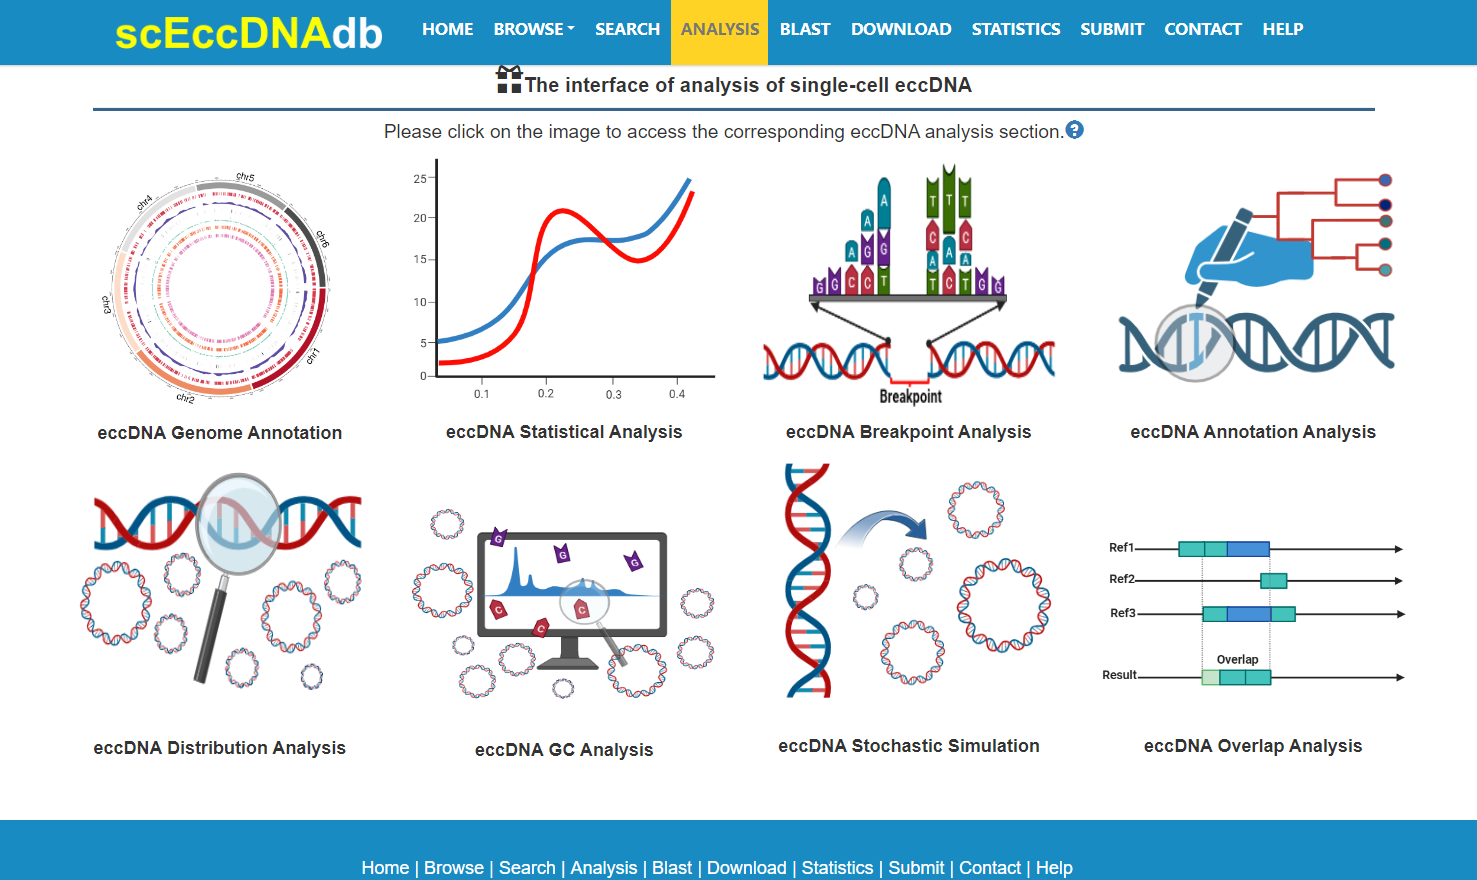
Extrachromosomal circular DNA (eccDNA) is a specialized form of extrachromosomal circular structured DNA that is widely observed in eukaryotes and plays crucial roles, such as tumorigenesis, immune response, and biomarker identification. To facilitate access to single-cell level eccDNA data for researchers, we have developed the scEccDNAdb, a comprehensive database based on visible single-cell whole gene sequencing data. This database encompasses 3,195,464 eccDNAs from 2,825 cells derived from both human and mouse species across two sample types: disease and health. Additionally, we provide various annotated information for each eccDNA entry along with nine analysis modules including eccDNA Distribution Analysis, Statistical Analysis, Breakpoint Analysis, Annotation Analysis, Stochastic Simulation, Overlap Analysis, GC Analysis, Genome Annotation and Blast. Furthermore, users can also submit their own single cell eccDNA datasets to our database.
scEccDNAdb stands as a comprehensive repository, offering a wealth of data on single-cell eccDNA. Within its confines reside 3,195,464 eccDNAs, meticulously curated from both diseased and healthy specimens spanning human and mouse species. This invaluable resource is characterized by its extensive genomic annotation, encompassing 116,941 enhancers, 336,763 super enhancers, and 2,001,501 genes, which notably include 77,345 oncogenes. Furthermore, it houses 211,948 SNPs, 114,992,54 CTCF binding sites, 151,325,67 chromatin accessibility regions, 341,316 eQTLs, 2,705 miRNAs, and 114,992,52 transcription factors (TFs). Not to be overlooked are the 9,559,550 structural variants (SVs), 3,630,814 repeat sequences, and 242,063 methylation sites (m1A, m6A, m5C) that enrich its contents. Additionally, motifs from 2,800 samples are woven into the fabric of this database, rendering it an indispensable platform for delving deep into the intricacies of single-cell eccDNA biology.
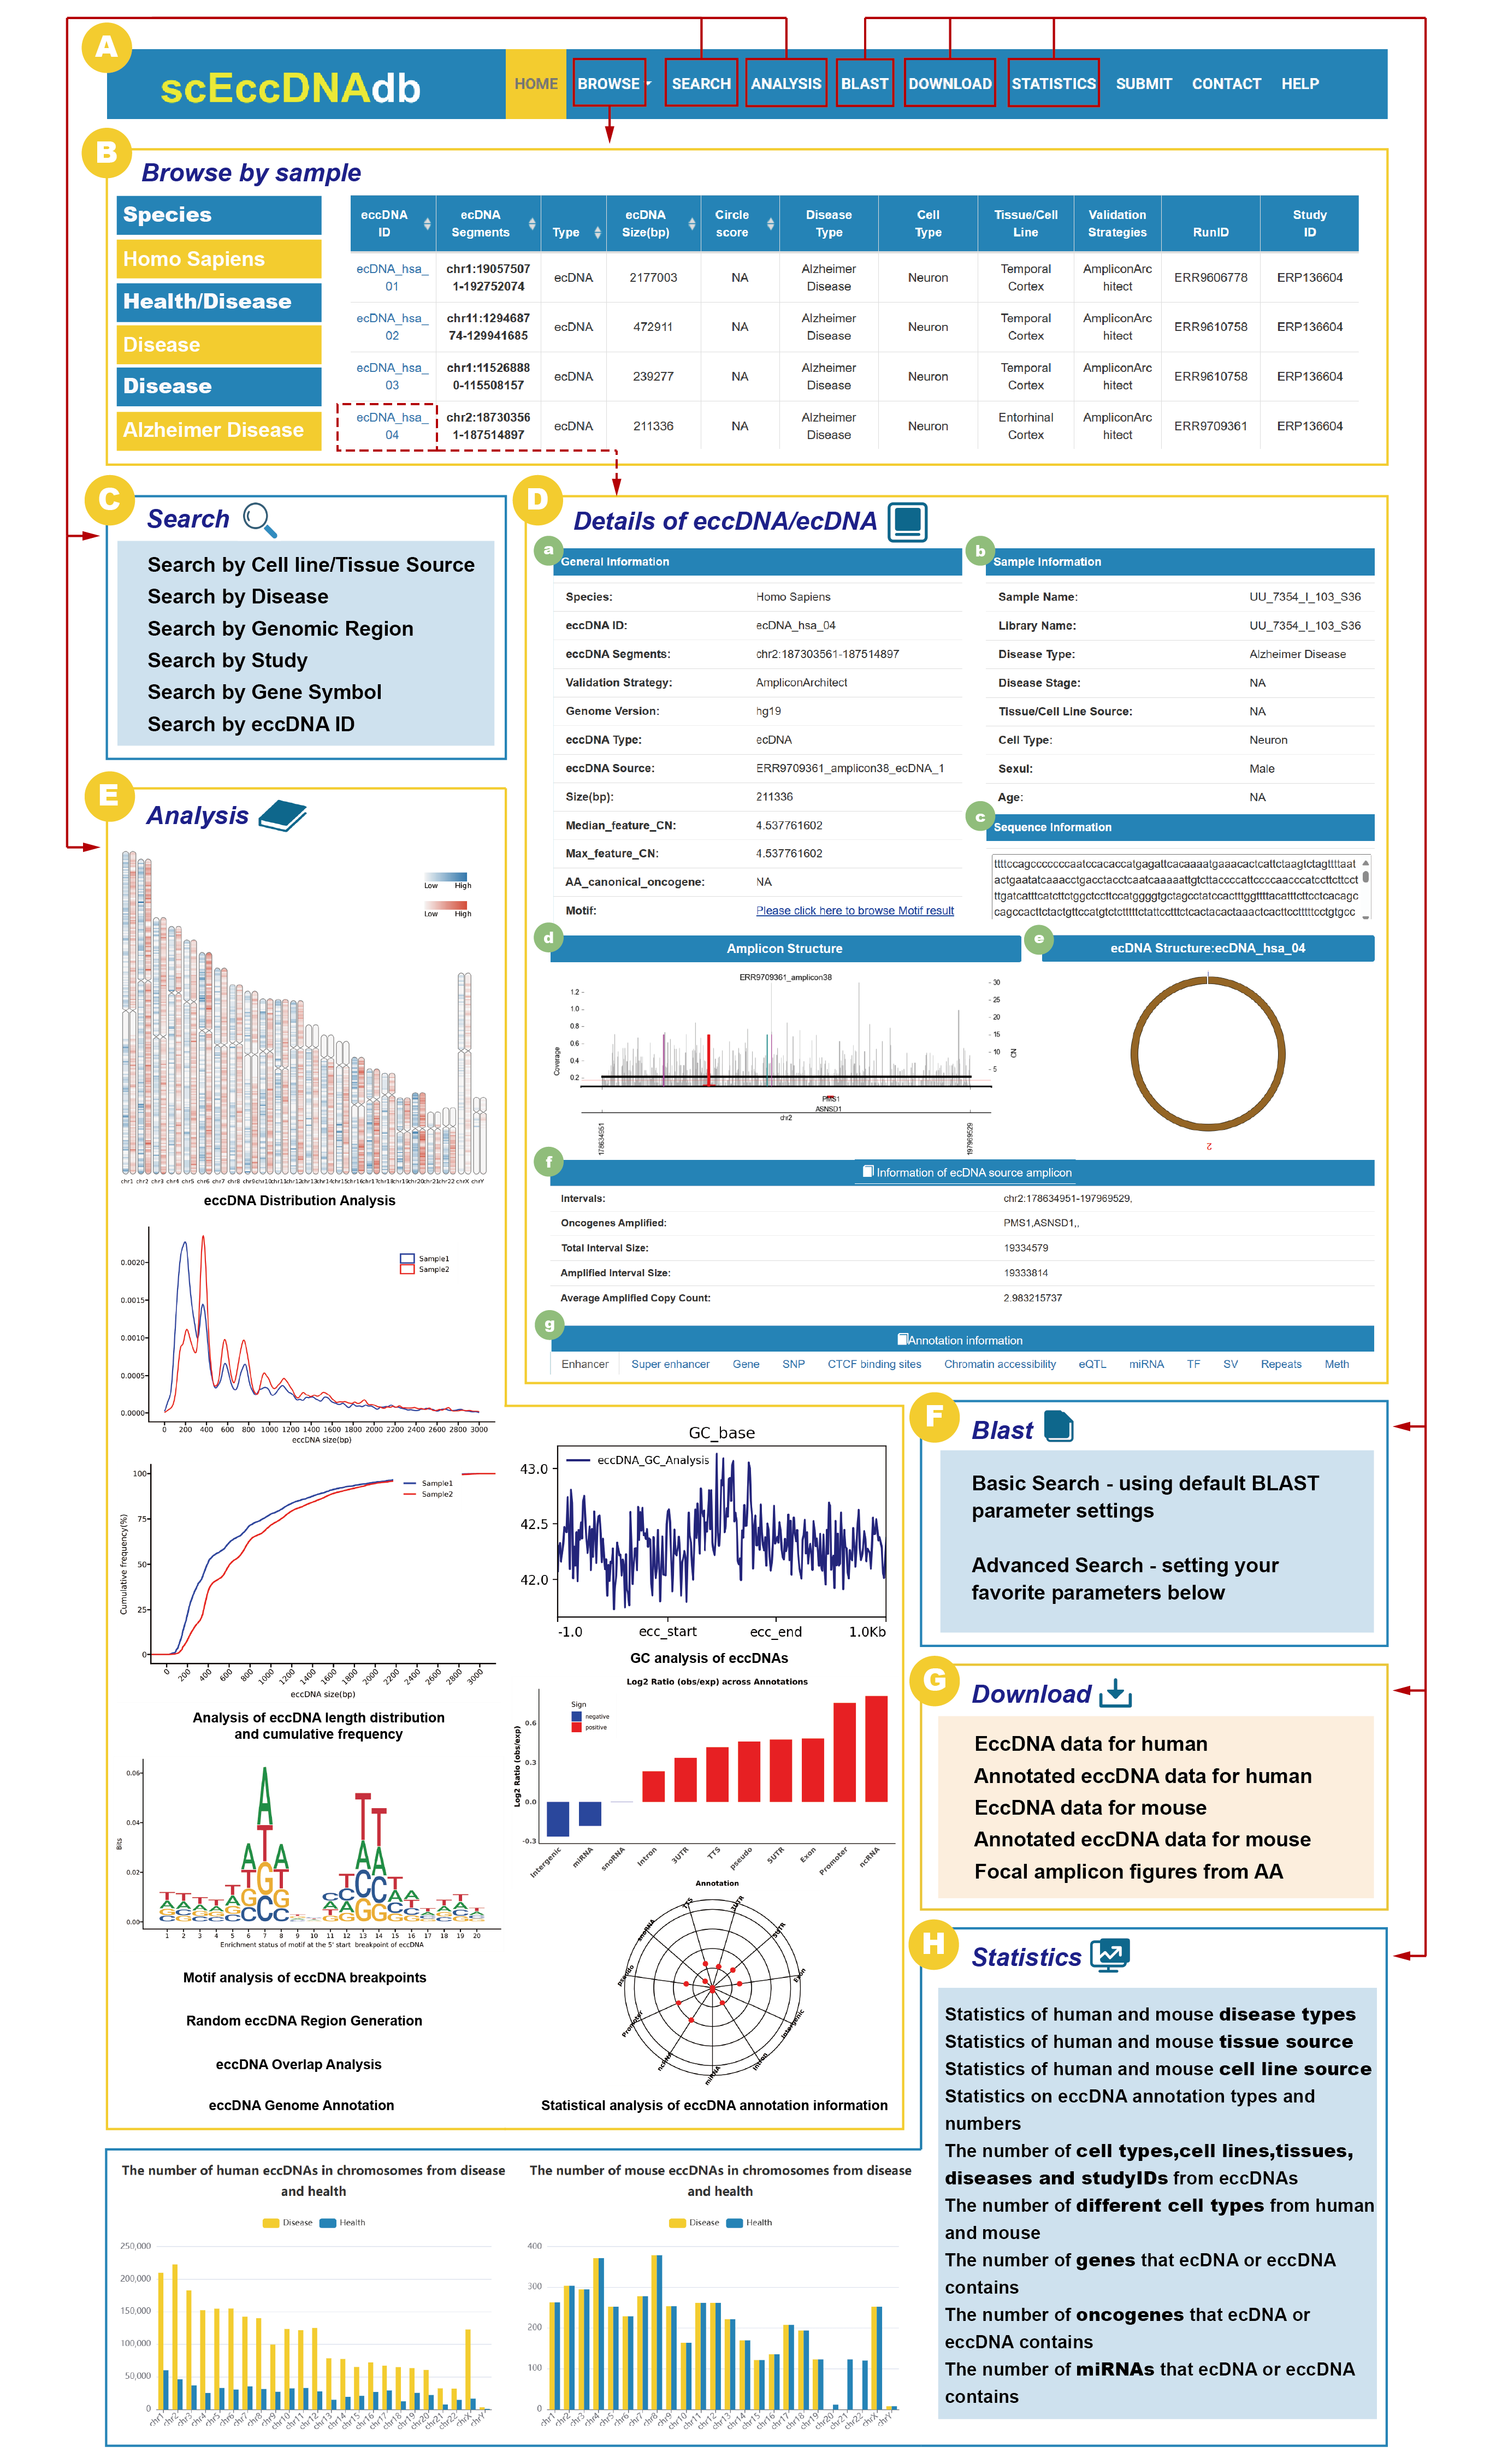
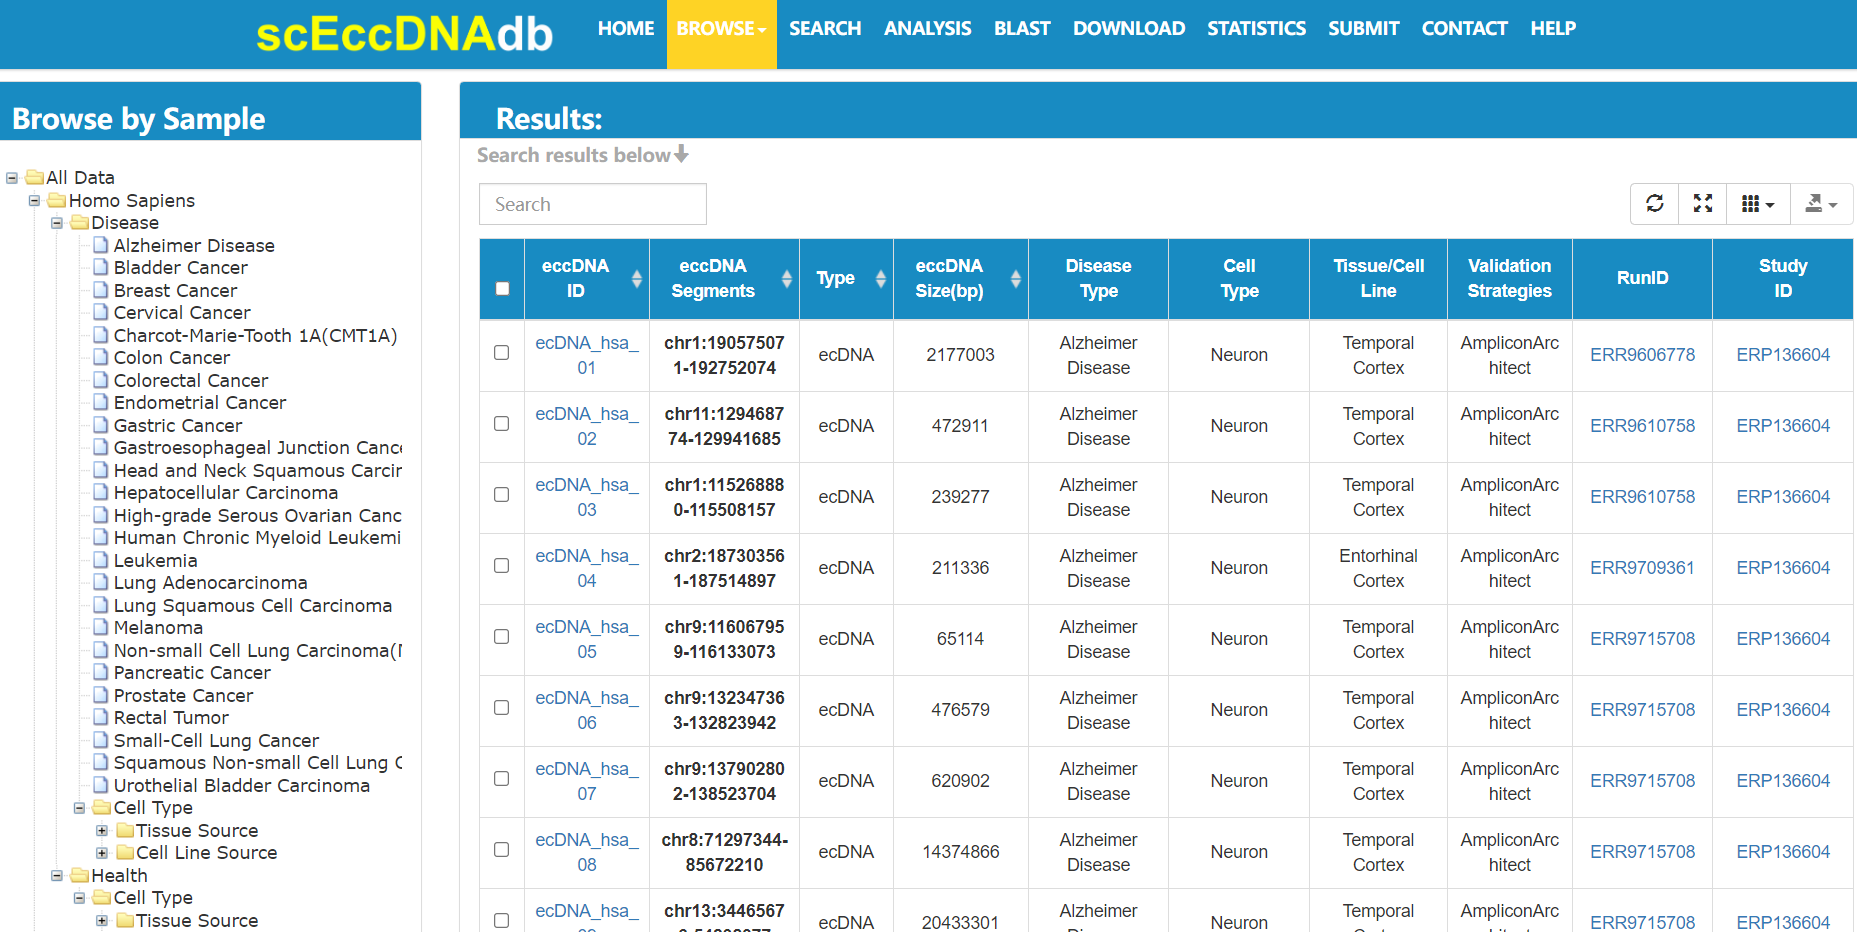
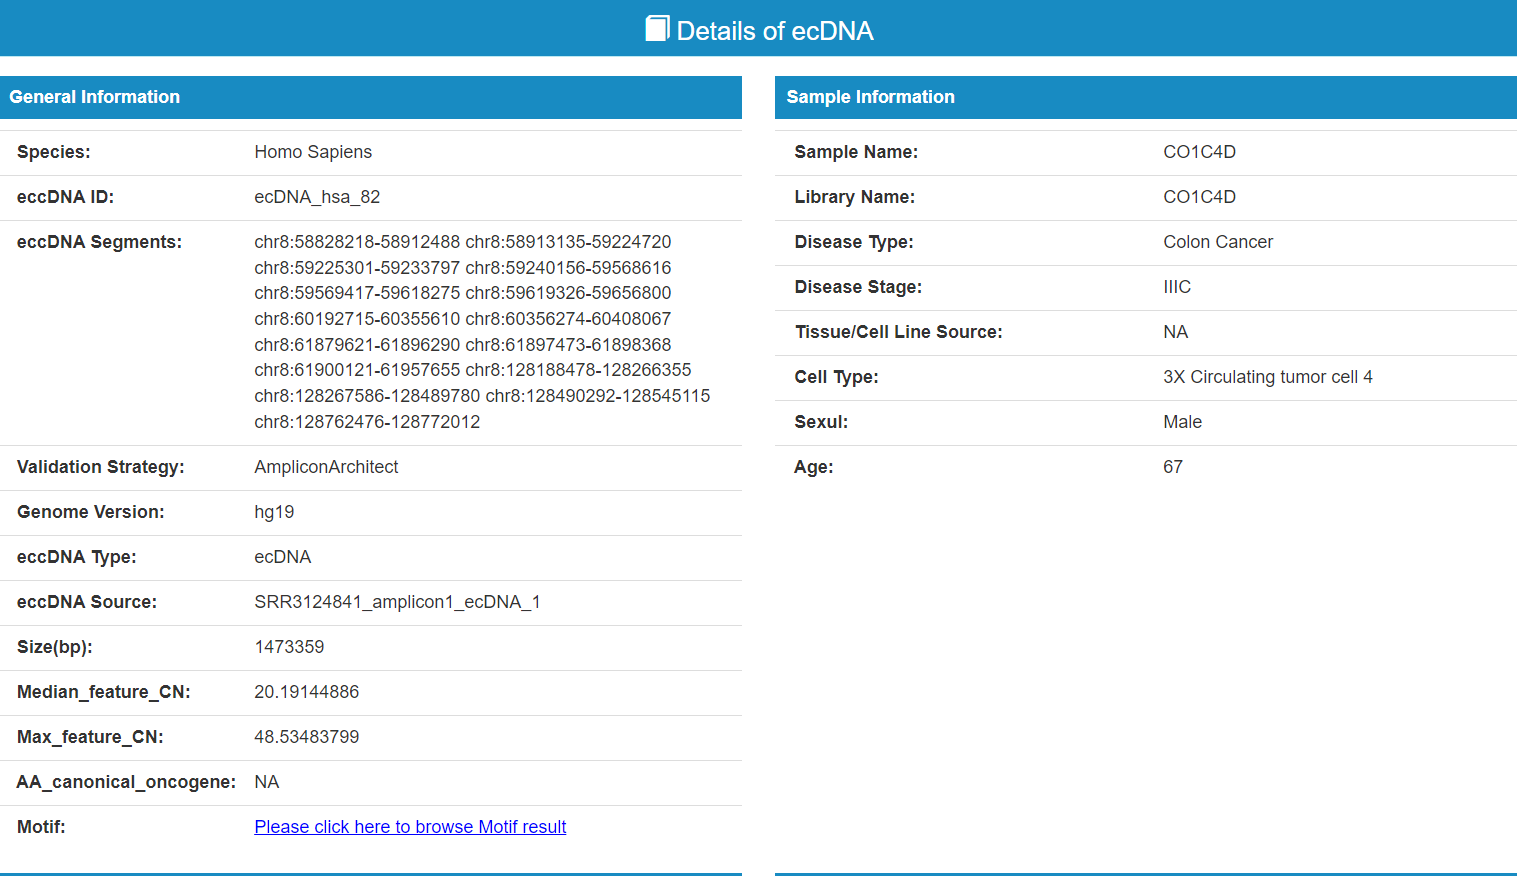
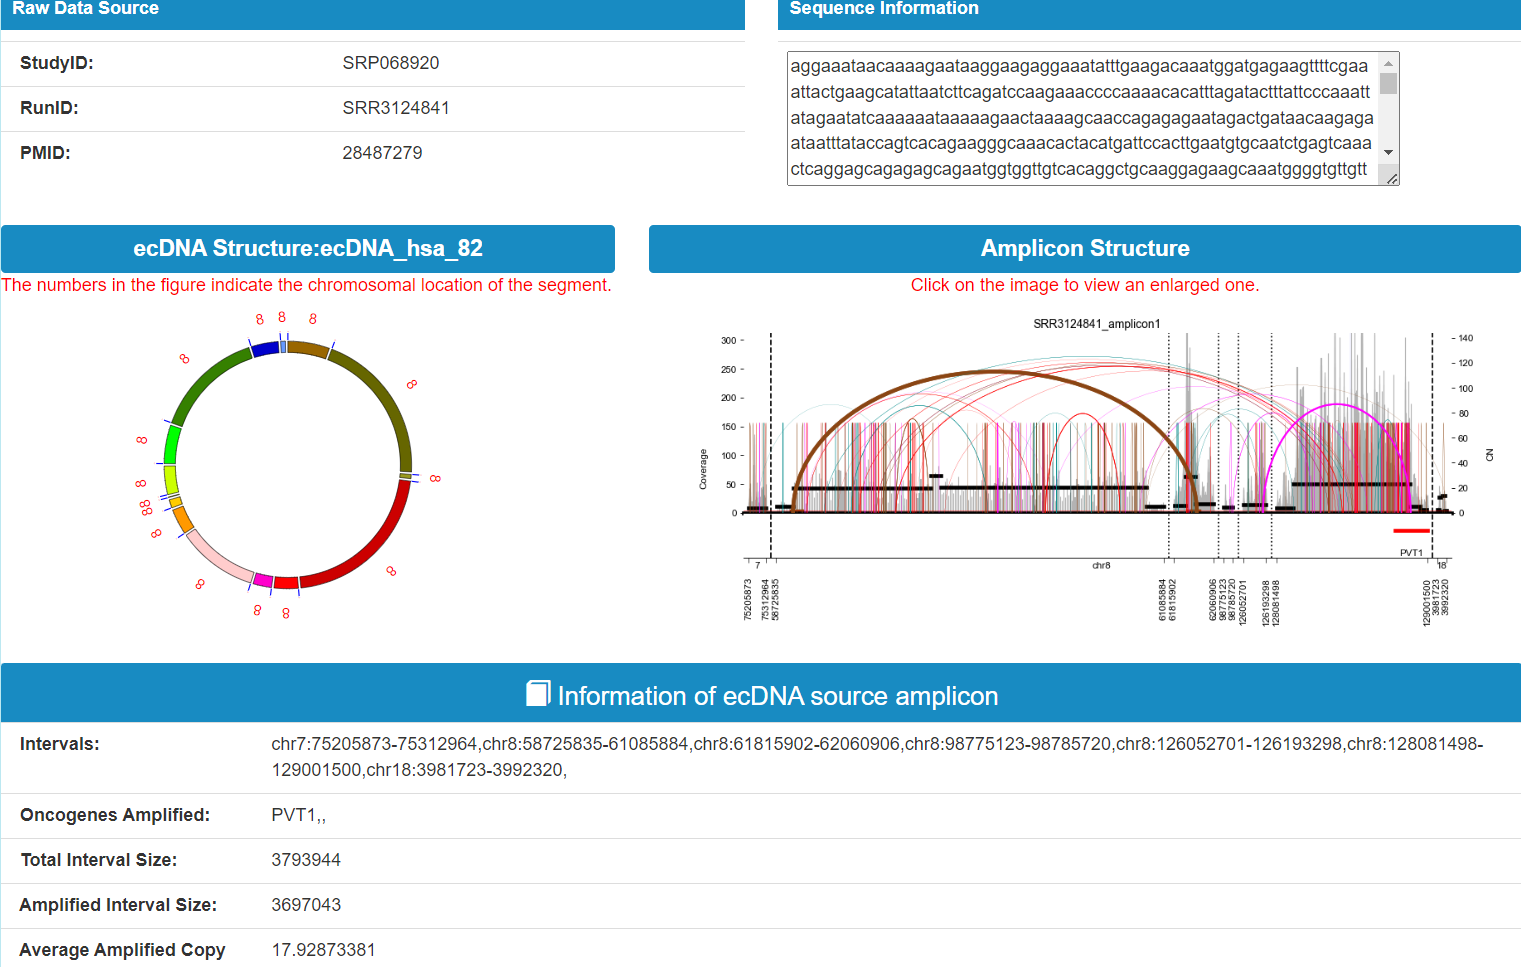
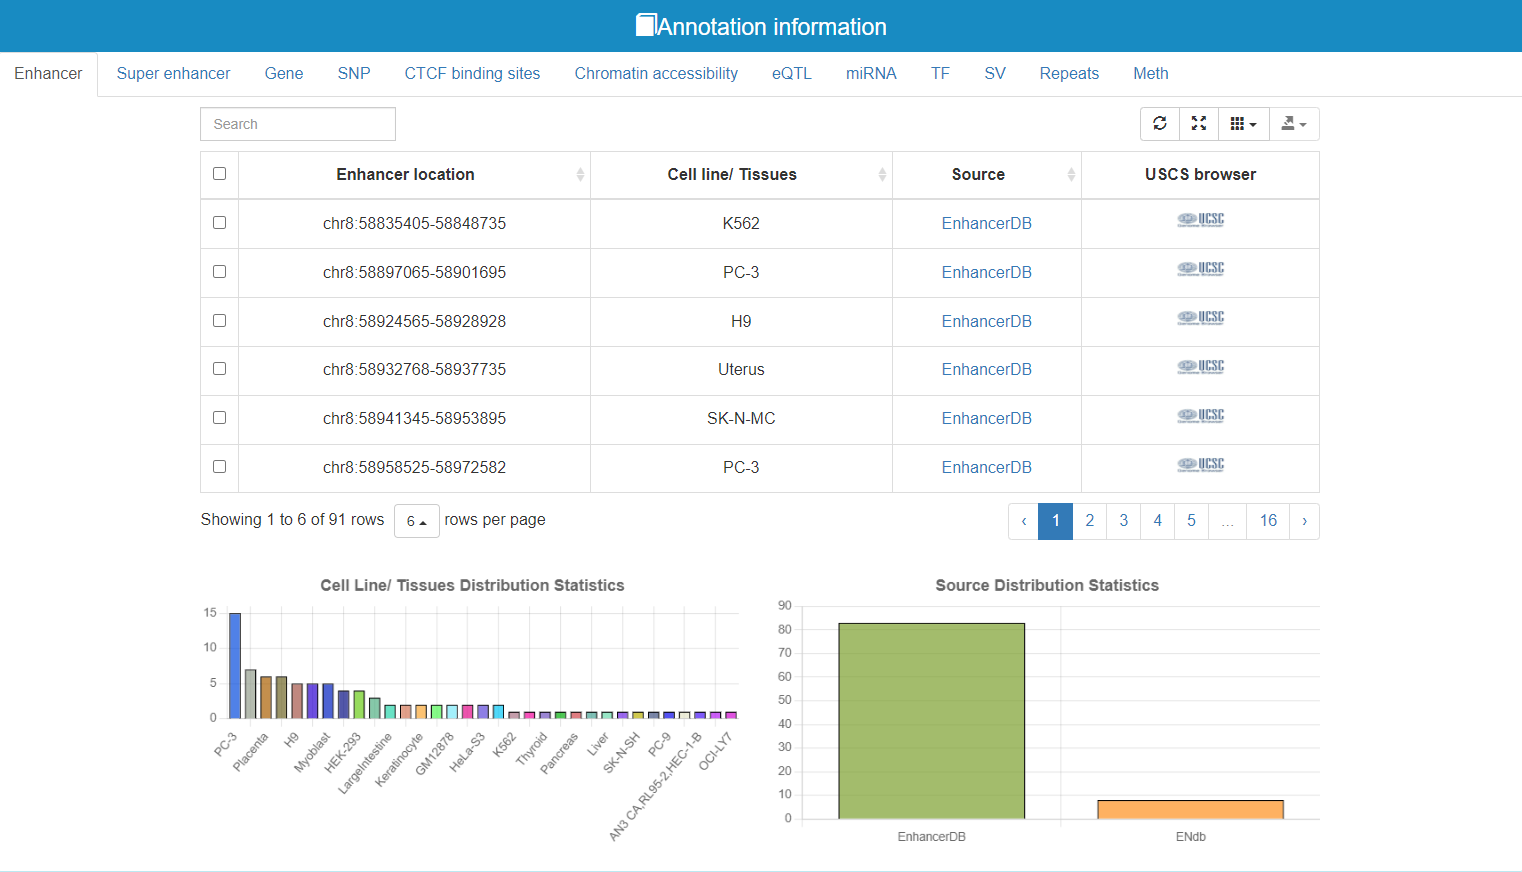
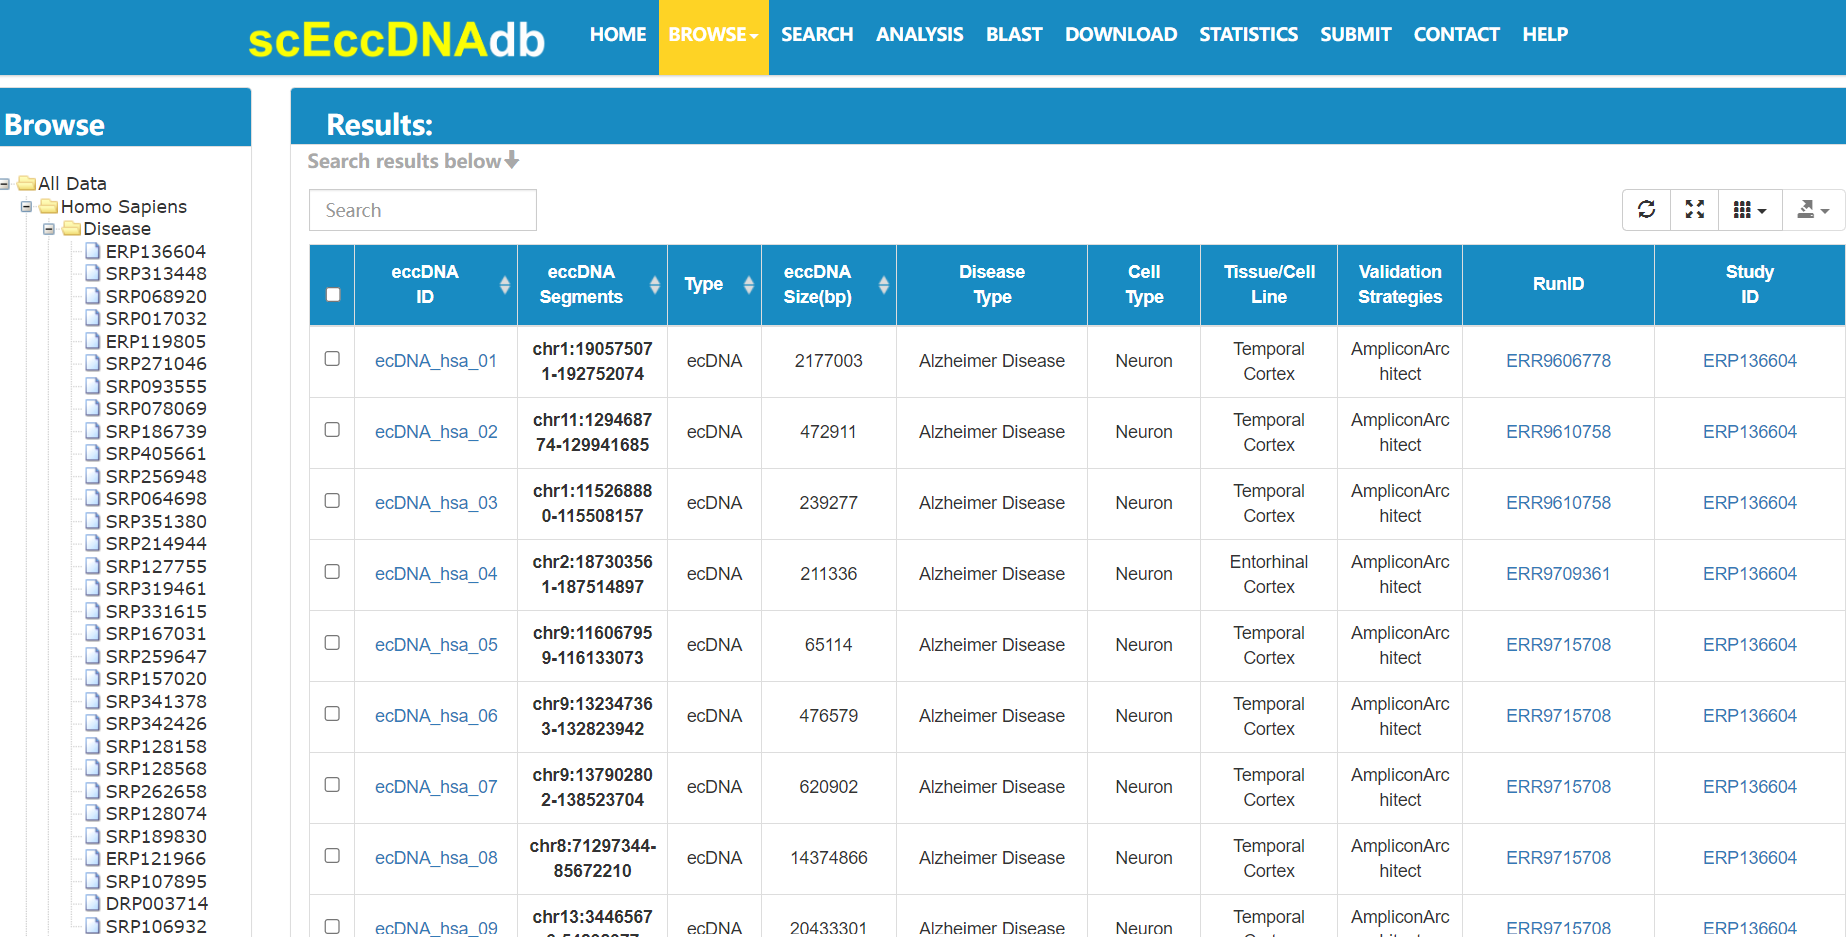
Allow users to click on the left side to select different species (Human/Disease), different sample types (Disease/Health), different tissues/cell line sources of single-cell eccDNA to browse, the right side will display eccDNAID, eccDNA region locus, eccDNA size, disease type, cell type, Tissue/ CellLine Source, runID ,StudyID, identification method, clicking on the eccDNA ID will display detailed information about the eccDNA, including General Information, Sample Information, Raw Data Source, Sequence Information, ring diagram of the eccDNA, annotation information. In addition to the detailed information, if you click on the ecDNA, it will show the amplification information and schematic diagram of the ecDNA; if you click on the ecDNA, it will show the quality information of the ecDNA.
URL:https://lcbb.swjtu.edu.cn/scEccDNAdb/Browse_select_ecdna.php
Here are the results of the detail information of ecDNA_hsa_82.
URL:https://lcbb.swjtu.edu.cn/scEccDNAdb/Browse_select_datasets.php
Allows the user to select different species (Human/Disease), different sample types (Disease/Health), and different studies to browse eccDNA.
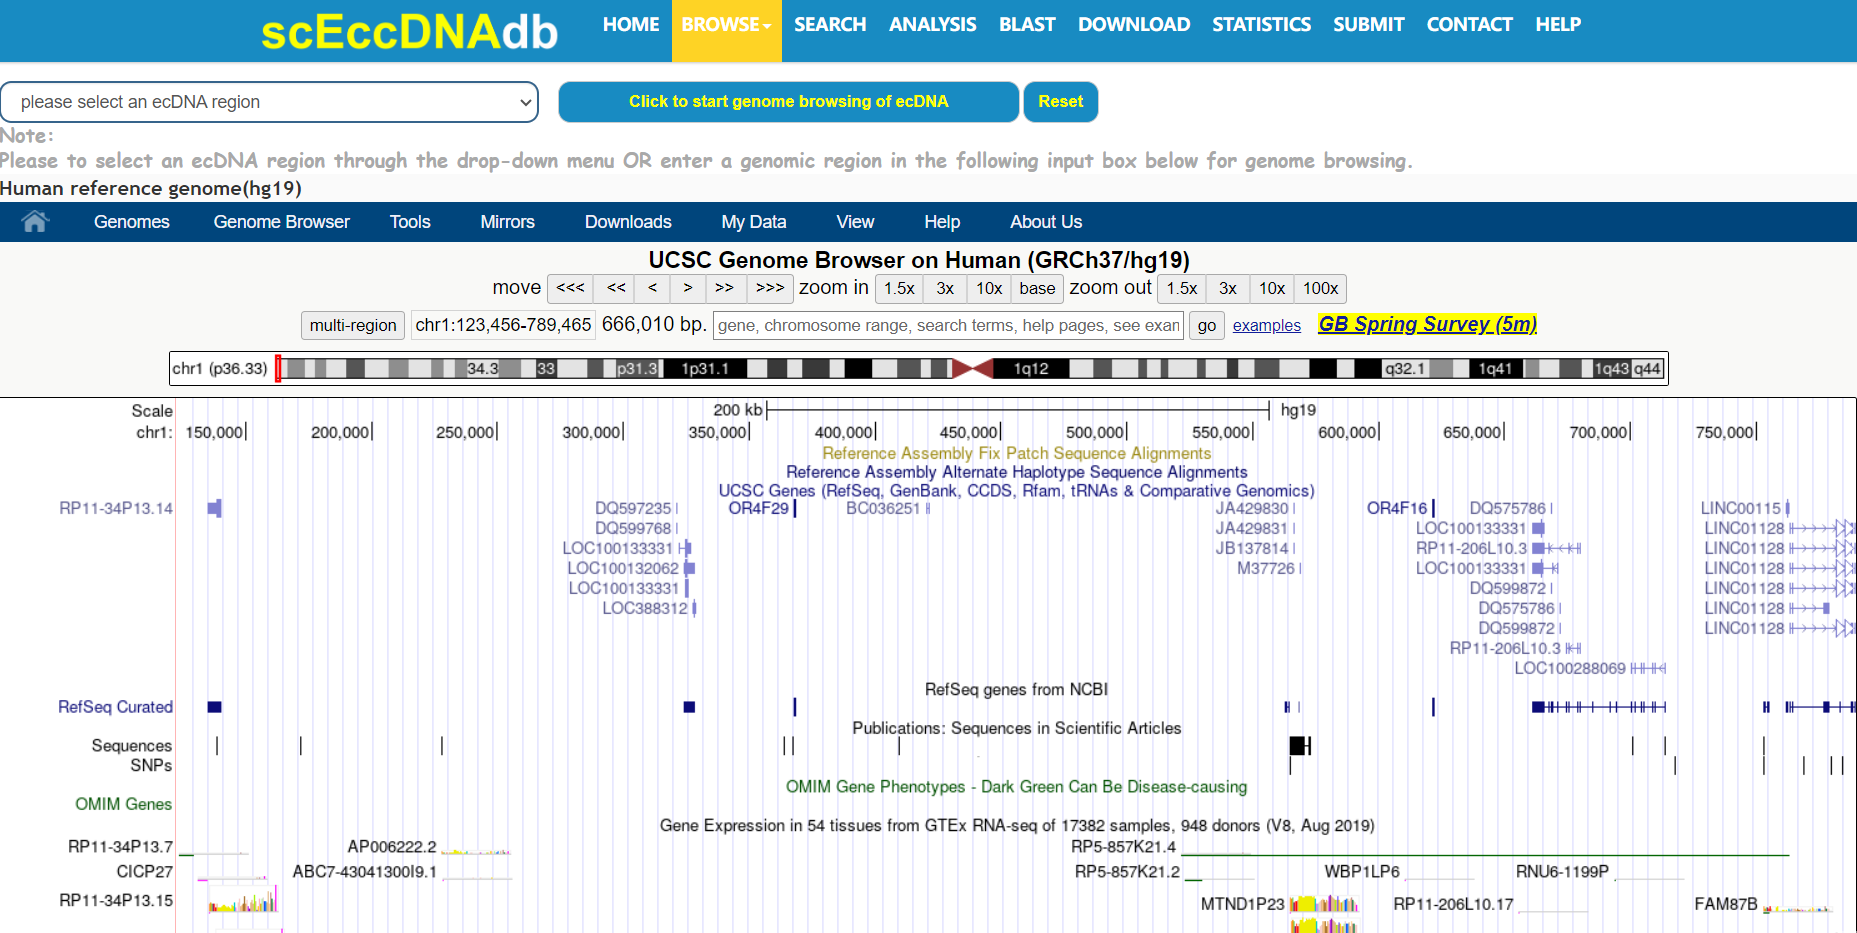
URL:https://lcbb.swjtu.edu.cn/scEccDNAdb/Genome_Browser.php
Visualization annotation of database/user-defined eccDNA/ecDNA region.
URL:https://lcbb.swjtu.edu.cn/scEccDNAdb/Search.php
Search for eccDNA by species and sample source.
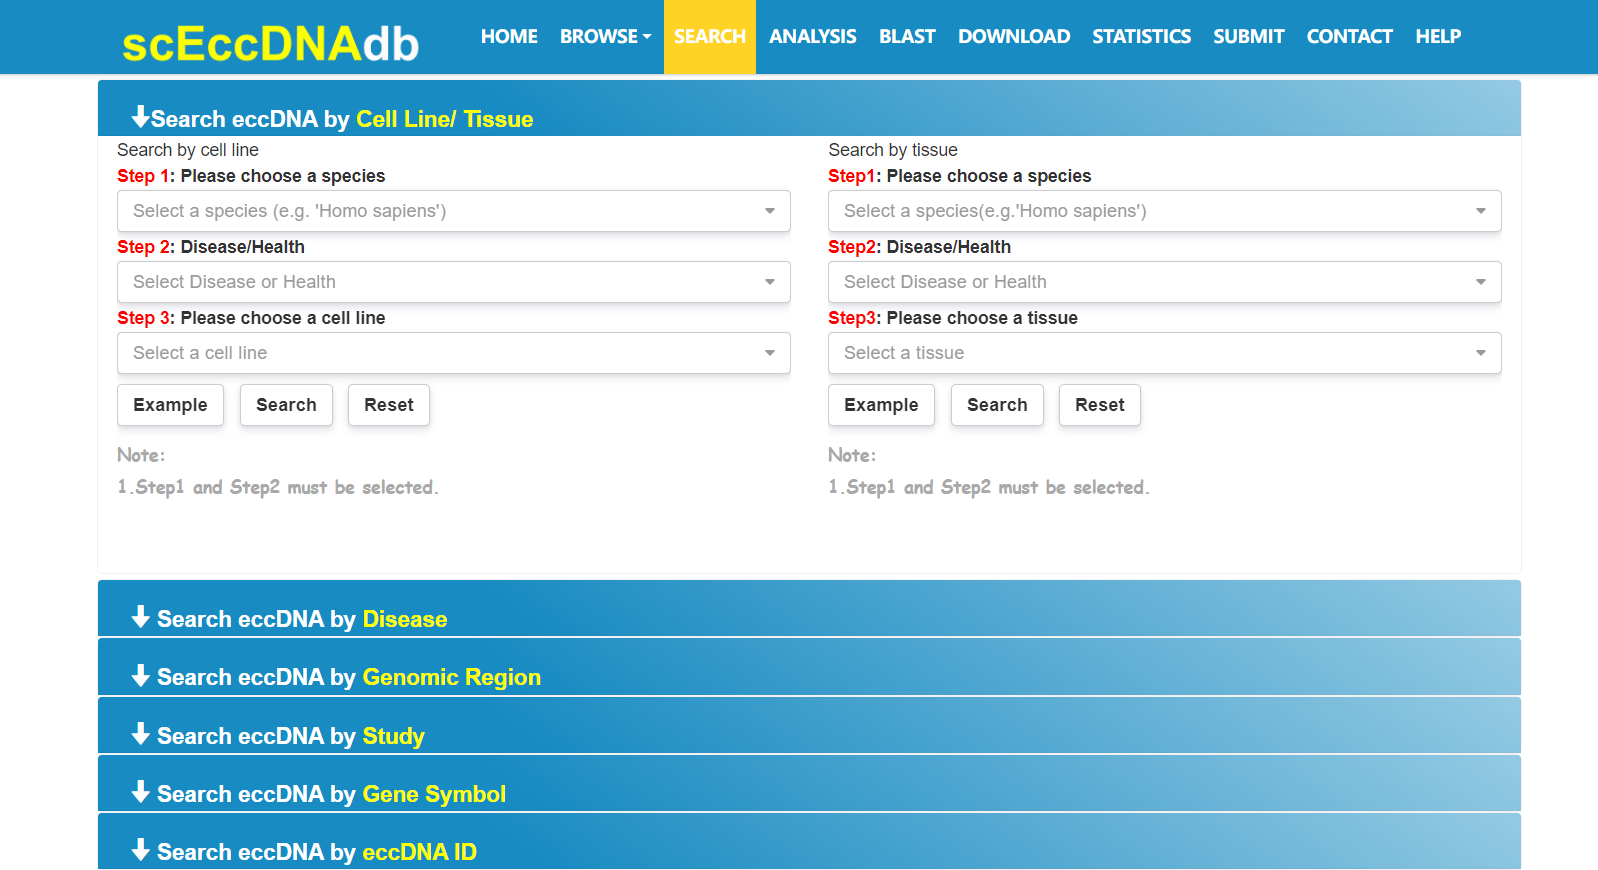
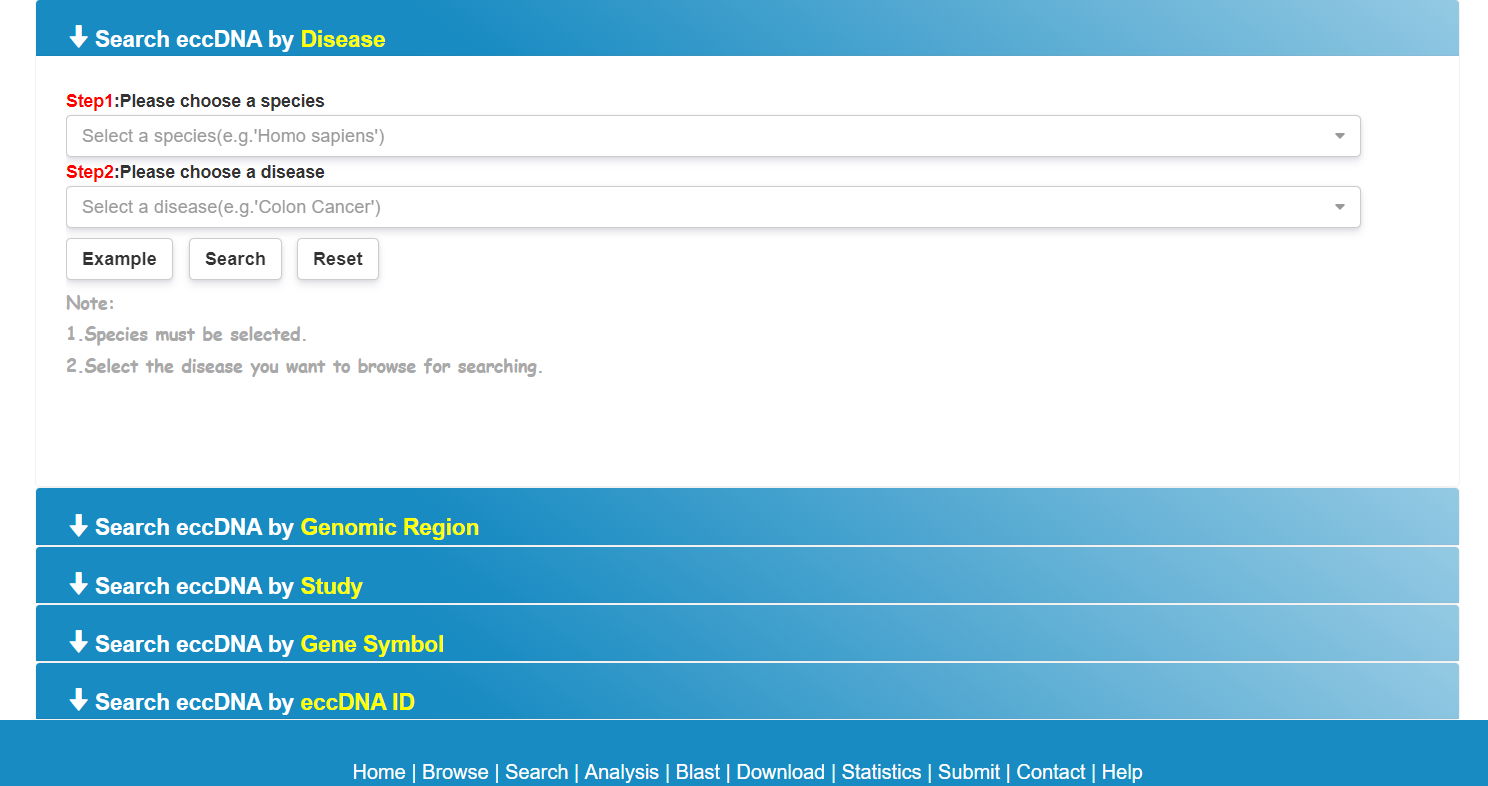
Search eccDNA by human and mouse disease.
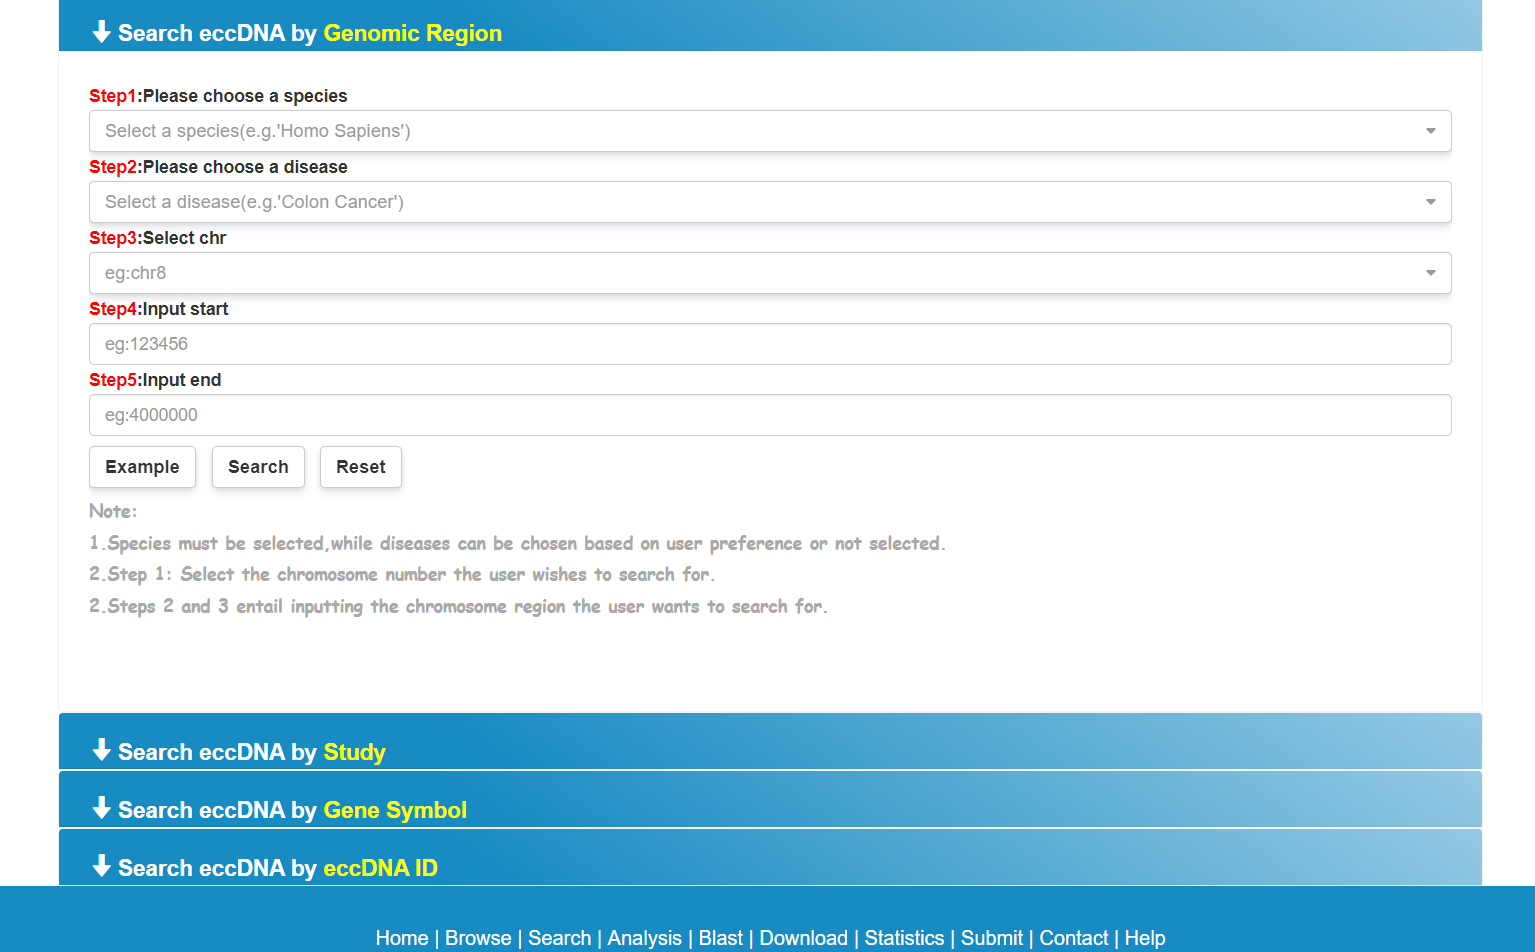
Search for eccDNA regions of interest to the user by customizing intervals.
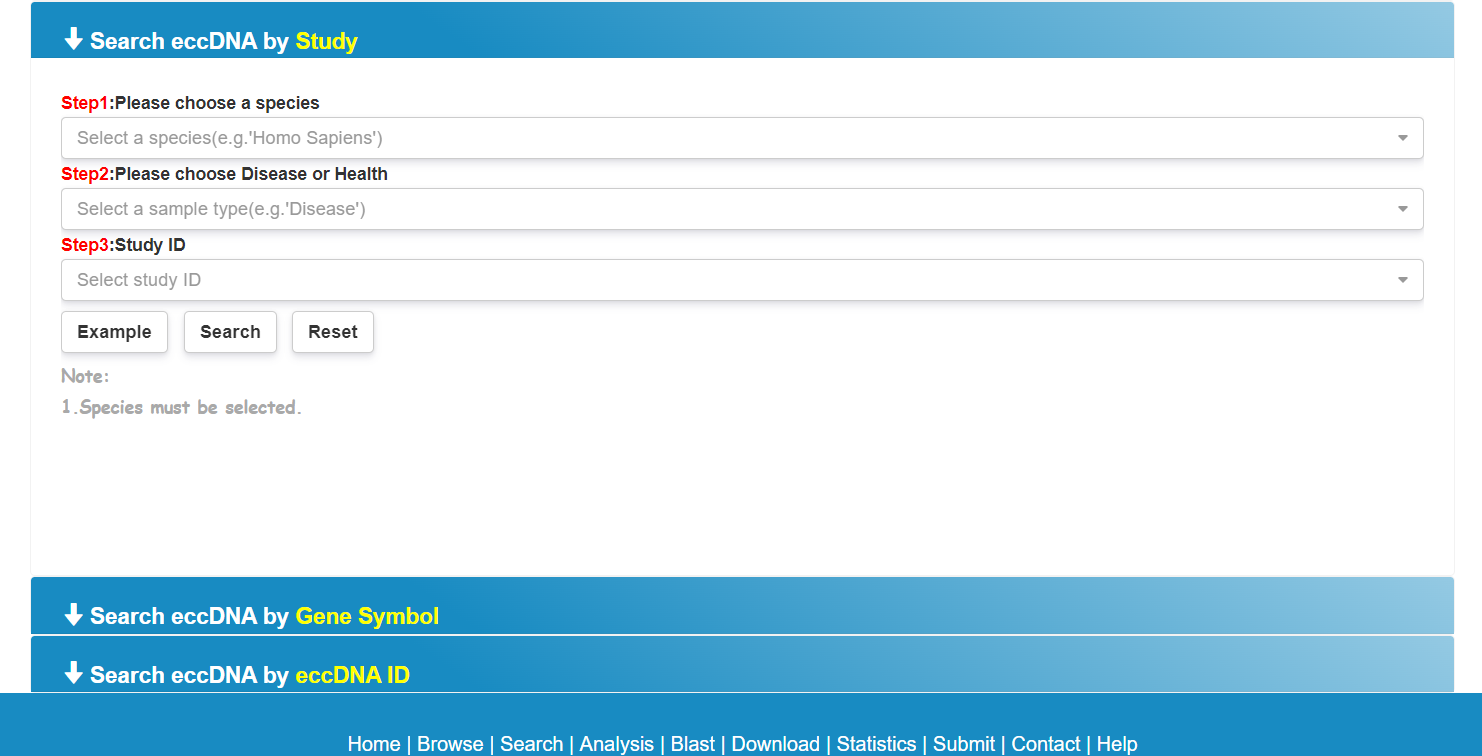
Search for human and mouse eccDNA data corresponding to study.
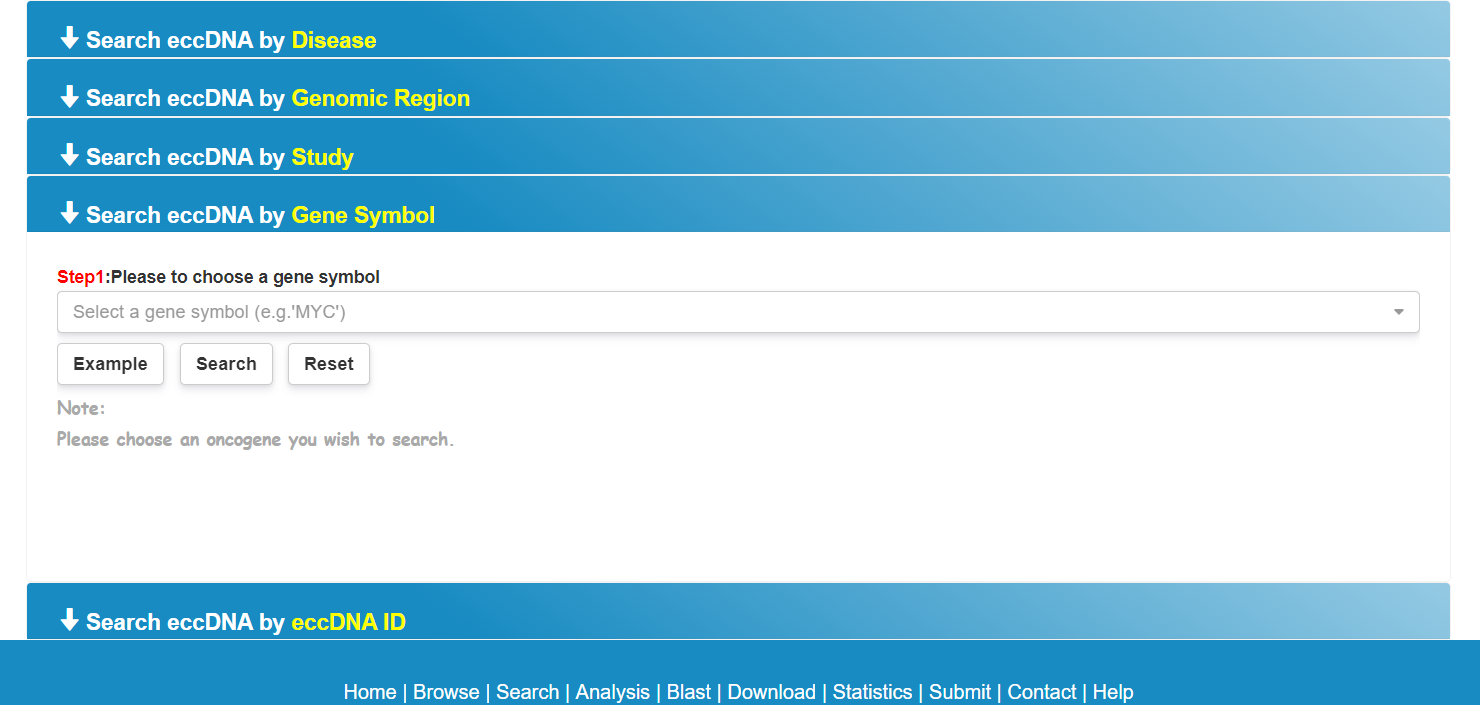
Search human eccDNA for eccDNA containing oncogenes.
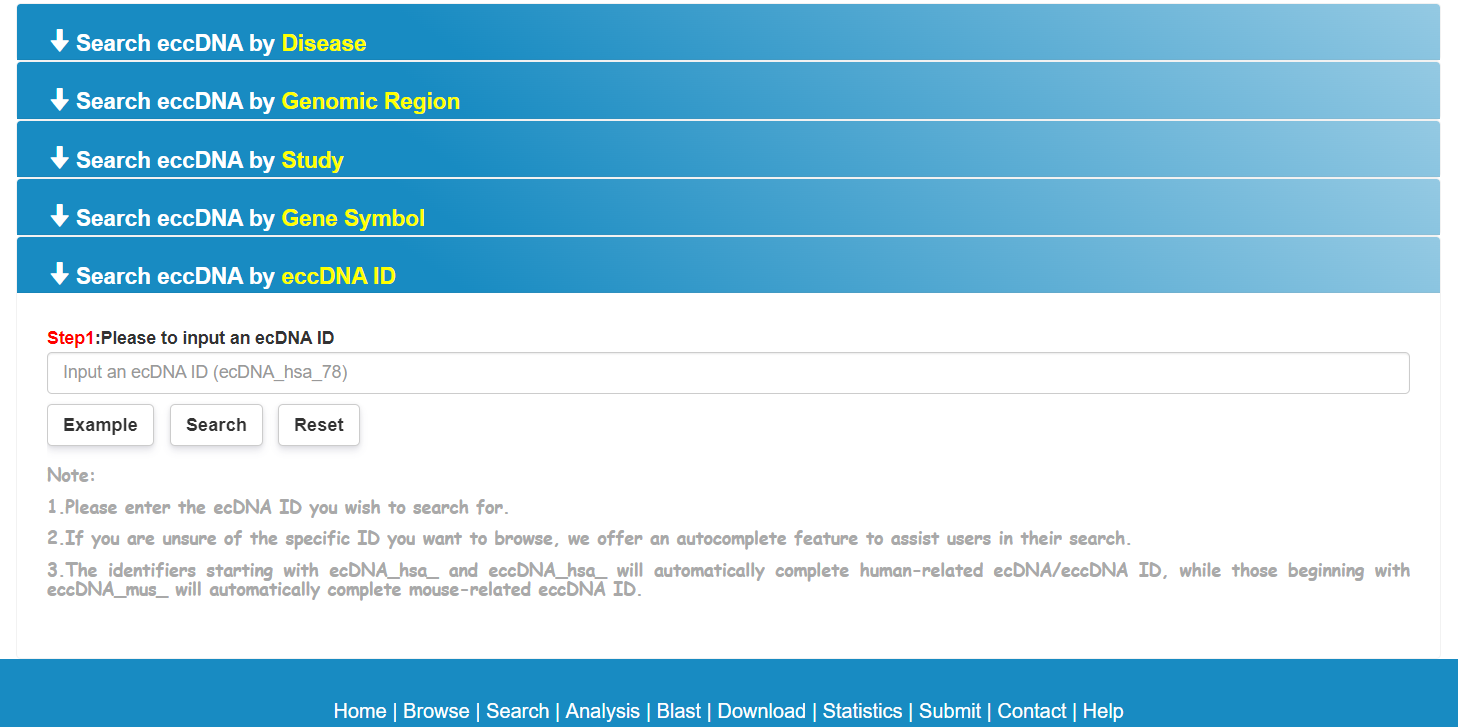
Used to search eccDNA data for specific IDs, the identifiers starting with ecDNA_hsa_ and eccDNA_hsa_ will automatically complete human-related ecDNA/eccDNA ID, while those beginning with eccDNA_mus_ will automatically complete mouse-related eccDNA ID.
URL:https://lcbb.swjtu.edu.cn/scEccDNAdb/Analysis3.php
URL:https://lcbb.swjtu.edu.cn/scEccDNAdb/Analysis.php
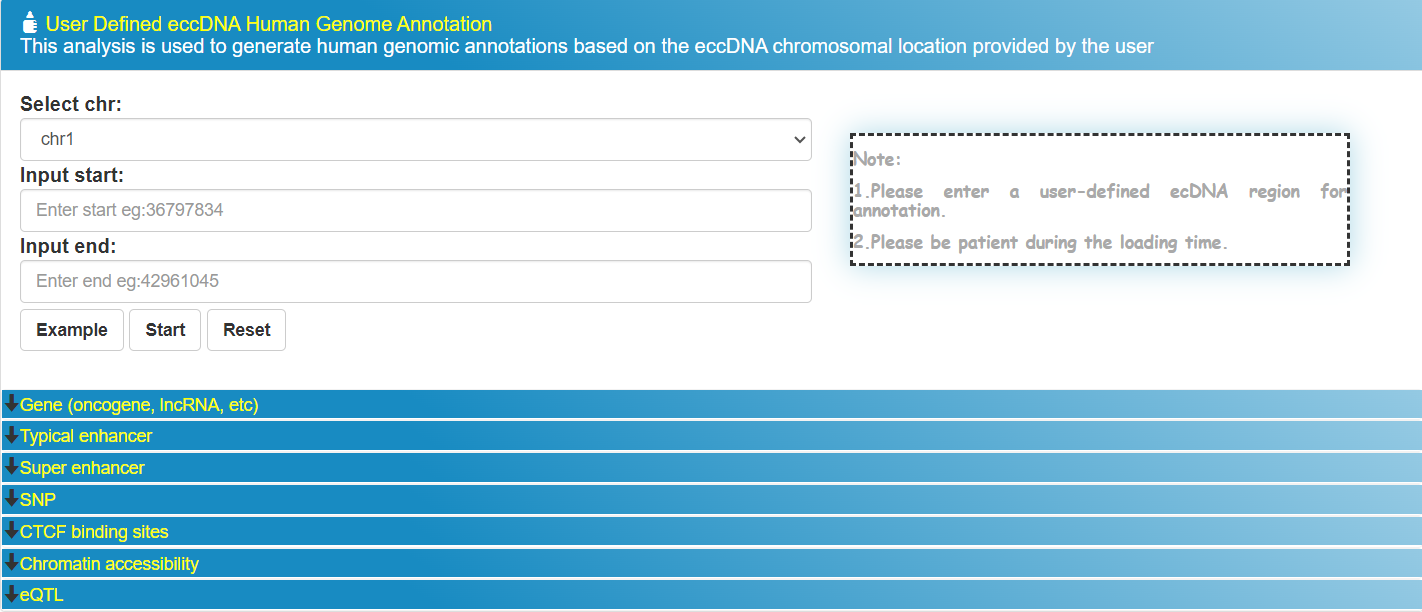
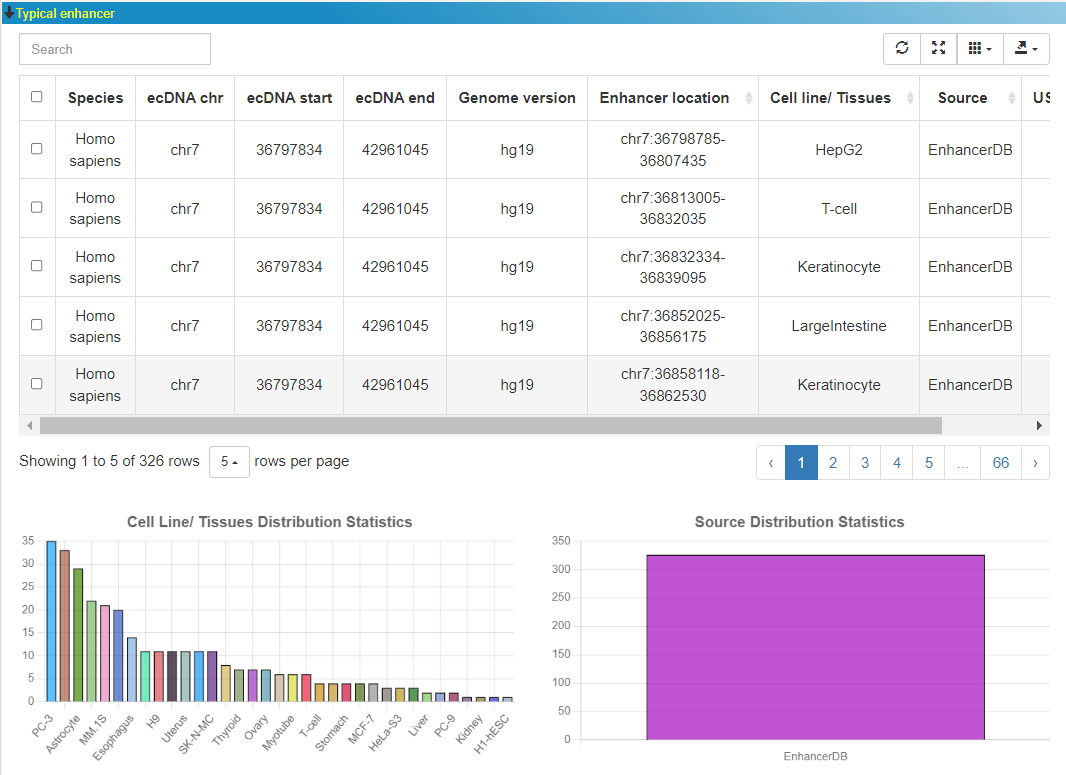
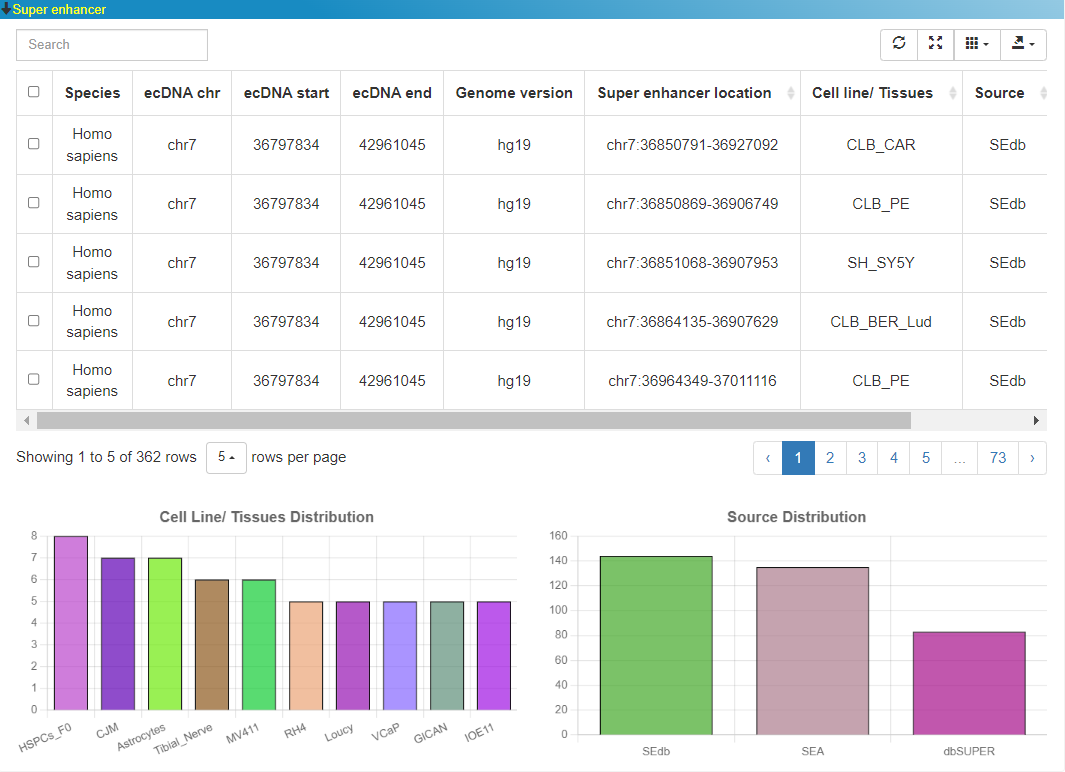
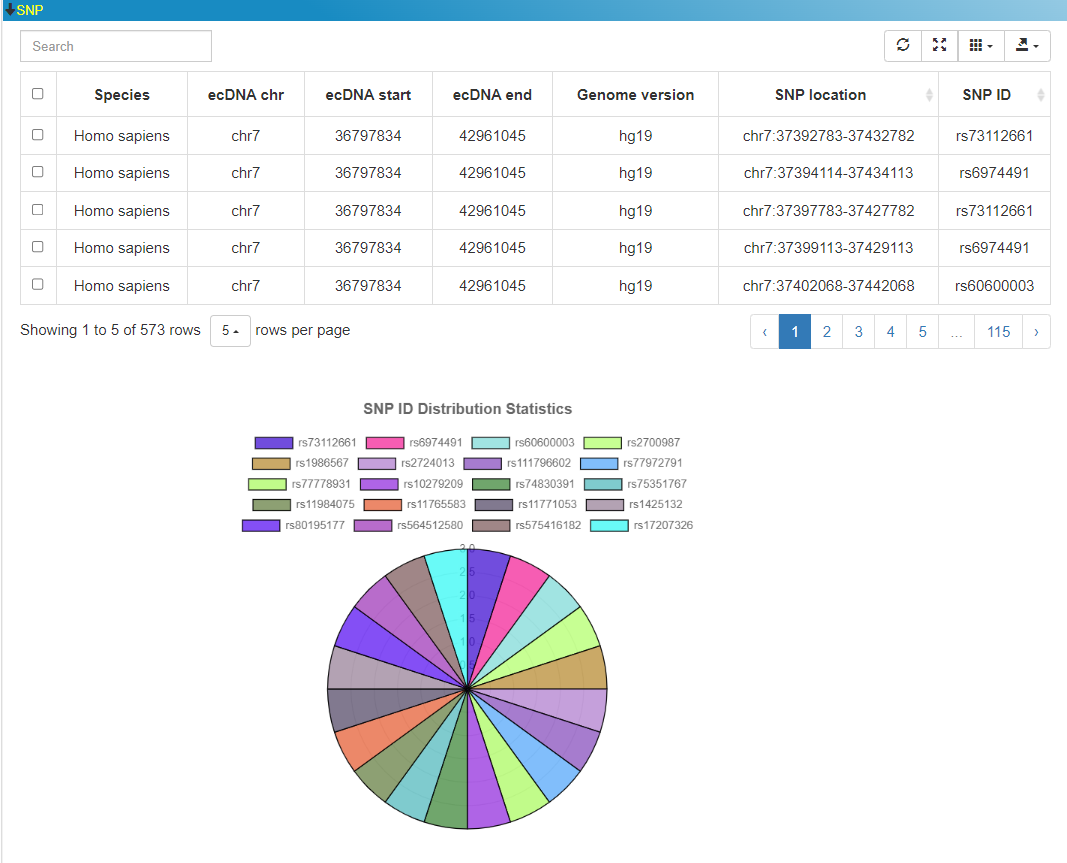
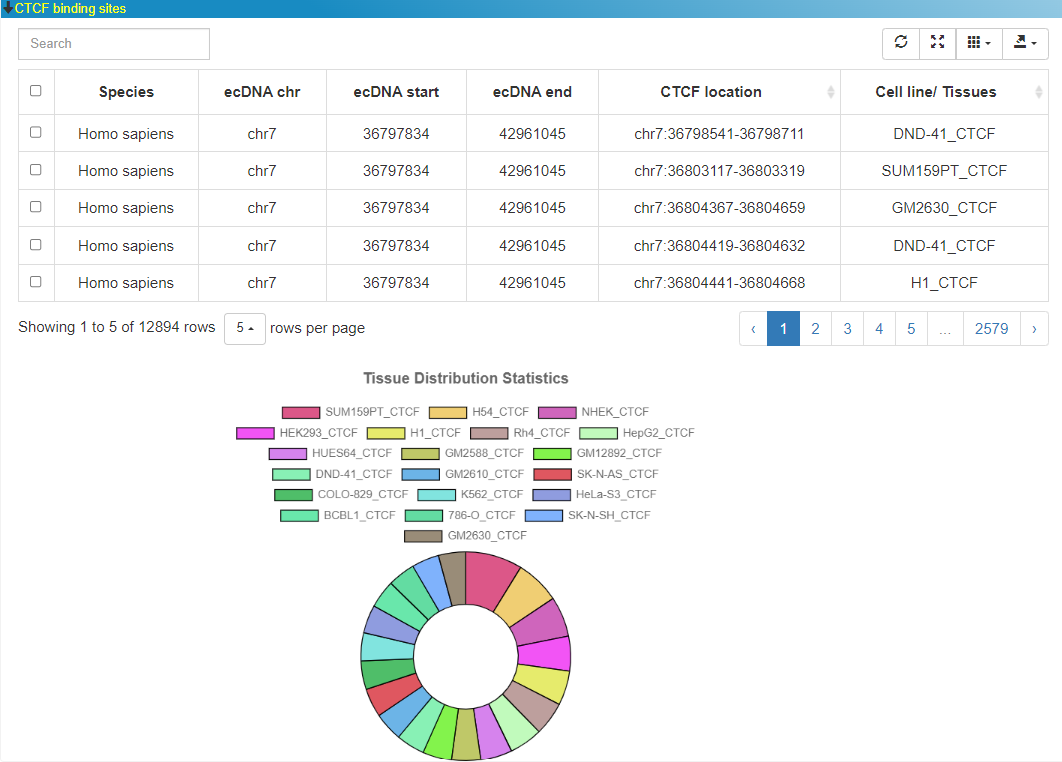
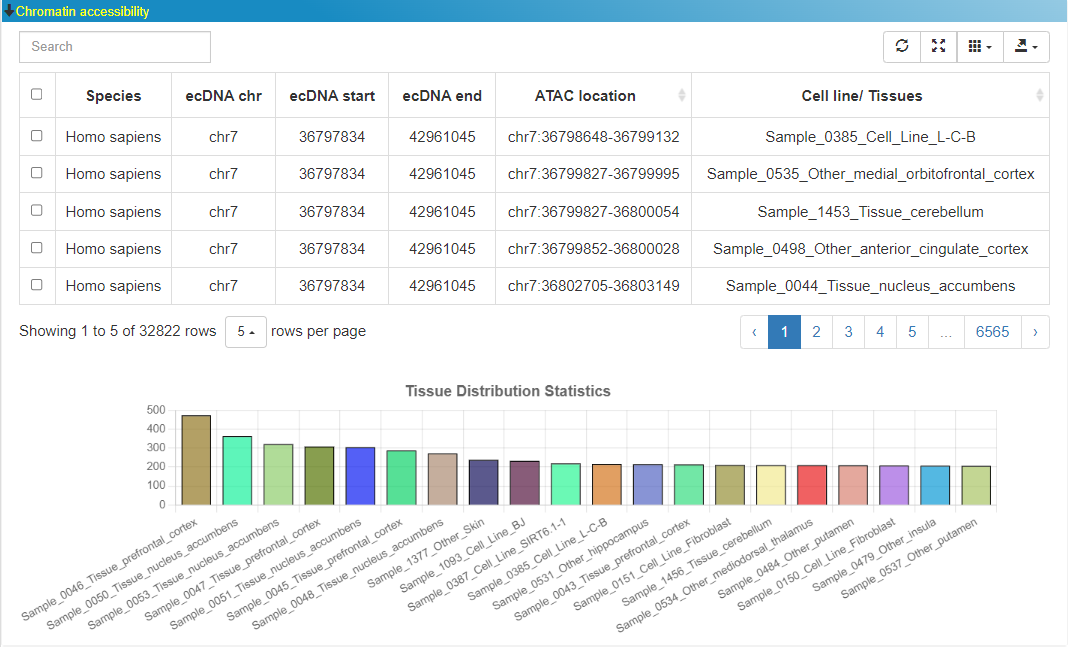
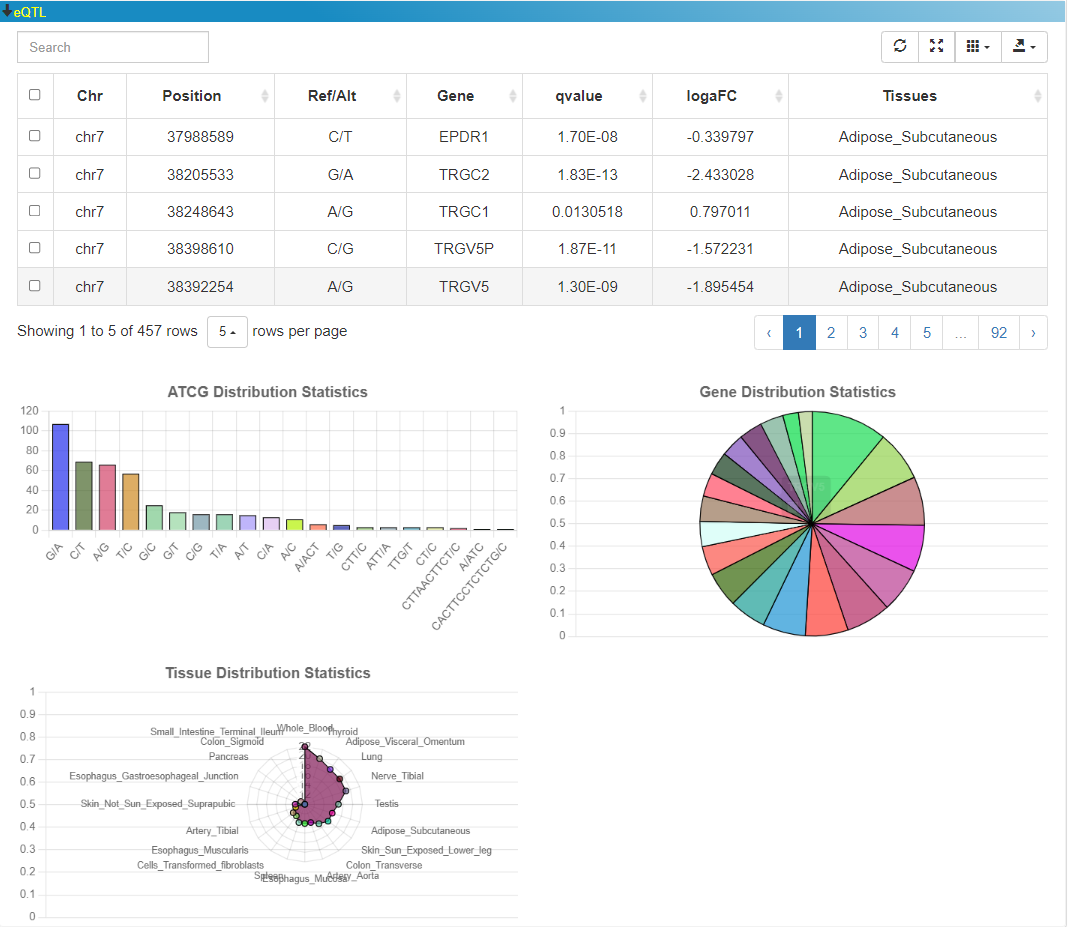
Users can submit a region of their own eccDNA (the average size of a typical eccDNA is 1-3Mb) to get information on the Gene (oncogene, lncRNA, etc), typical enhancer, super enhancer, SNP, CTCF binding sites, chromatin accessibility, and eQTL information.
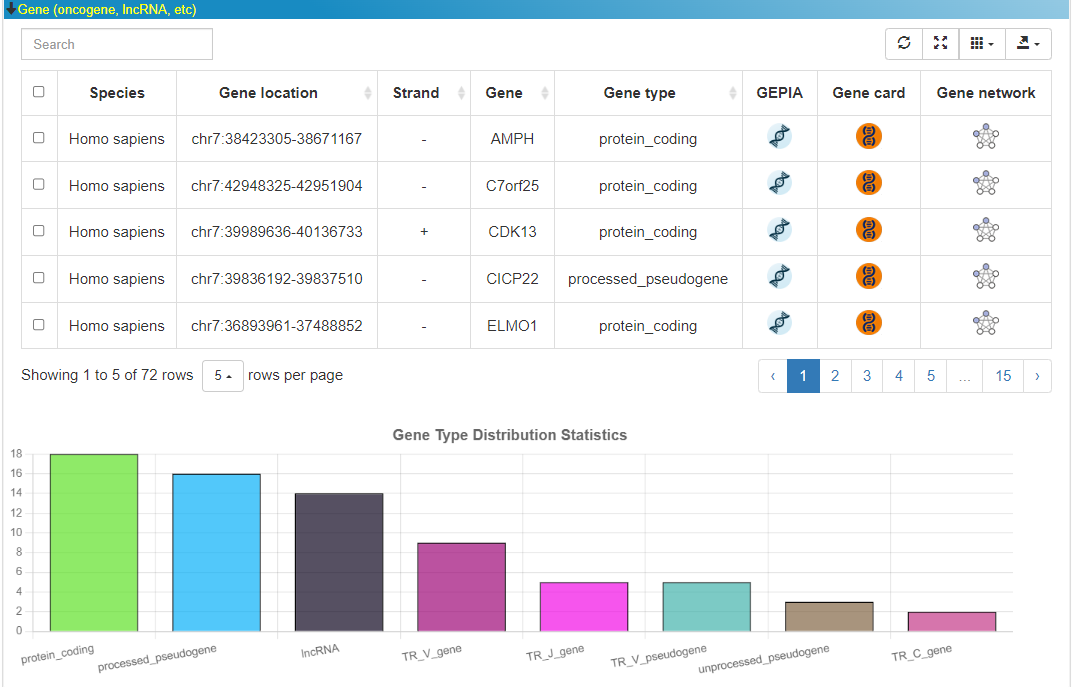
The results of the analysis of the example data are as follows.
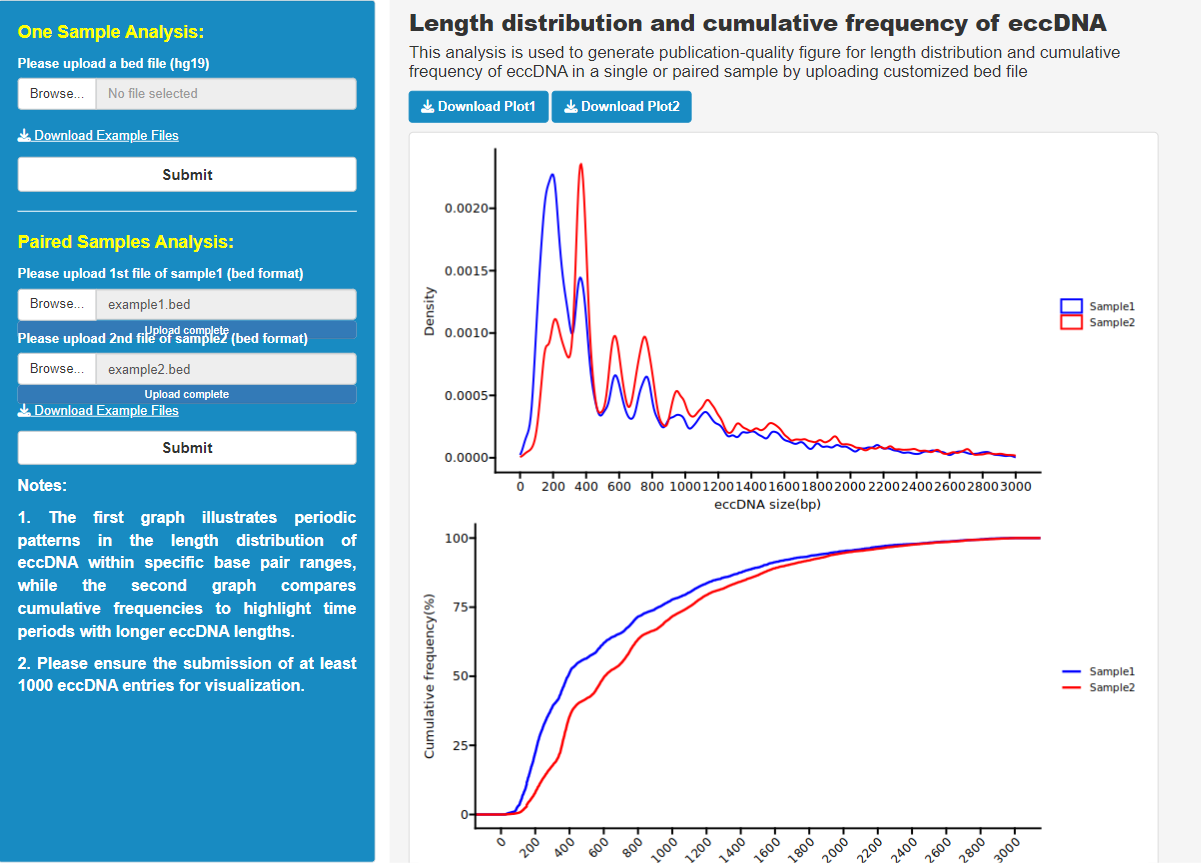
URL:https://lcbb.swjtu.edu.cn/scEccDNAdb/eccDNAStatisticalAnalysis.php
This module is for analyzing ecDNA length distribution and accumulation frequency. The user can submit ecDNA from a single cell or submit ecDNA from two cells for comparison. A periodic pattern of eccDNA length distribution over a specific base pair range will be obtained in Figure 1, and the cumulative frequency will be shown in Figure 2 to highlight the time periods of longer eccDNA lengths. It is important to note here to make sure that the submitted bed file has at least 1000 eccDNAs for visualization, the resulting image can be downloaded by clicking on the download button.
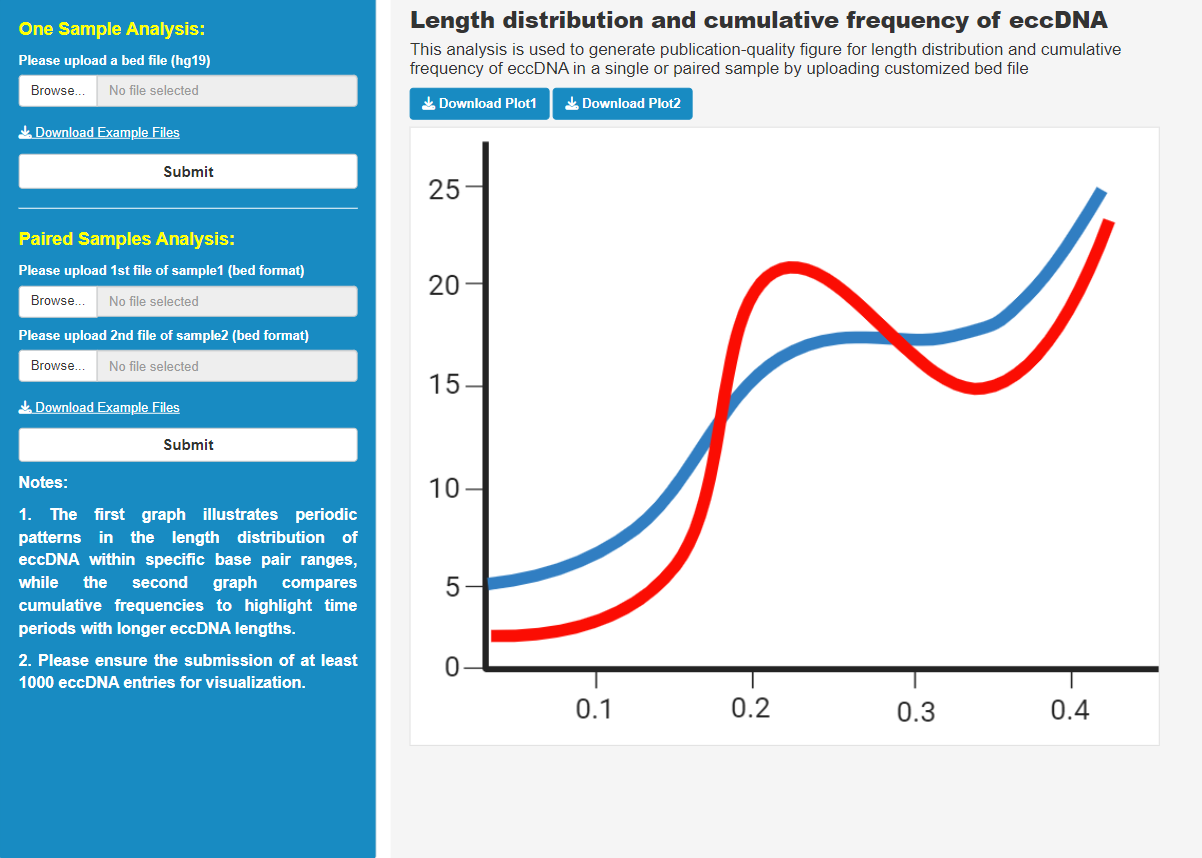
The results of the analysis of the example data are as follows.
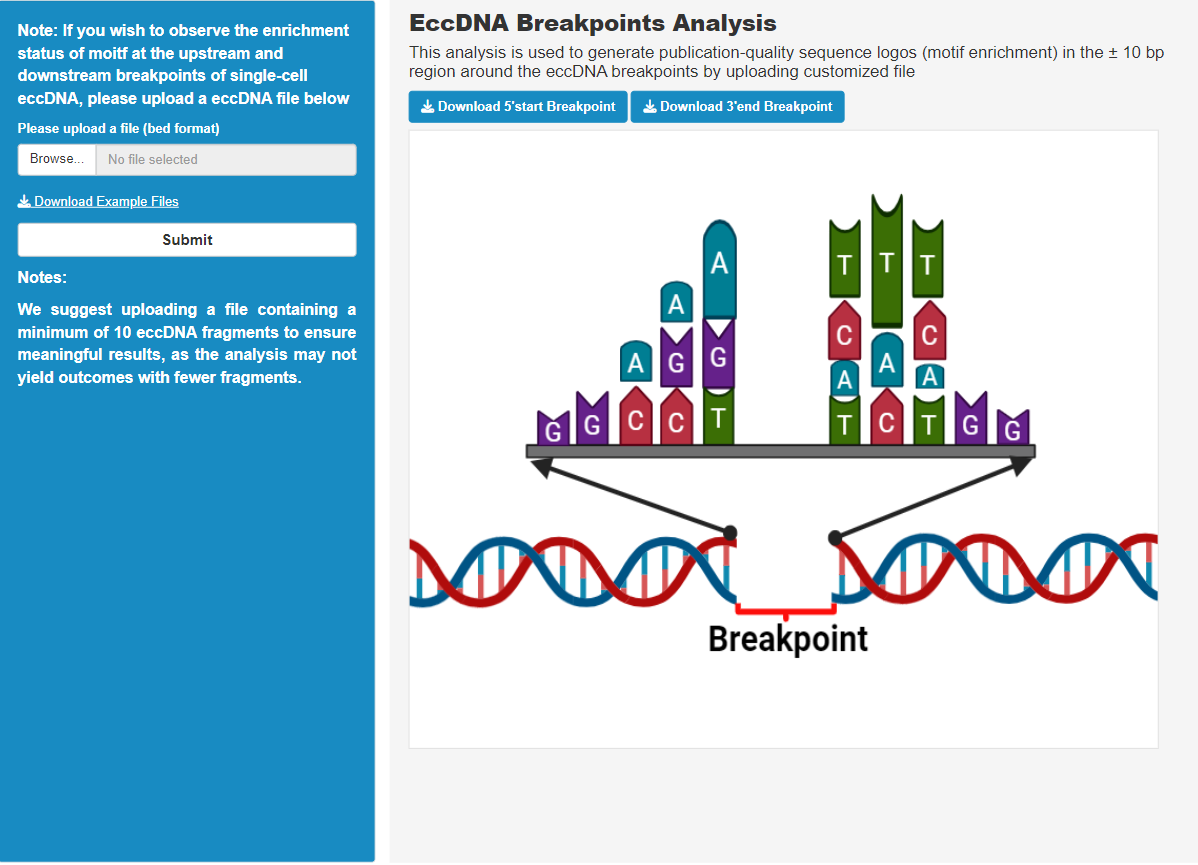
URL:https://lcbb.swjtu.edu.cn/scEccDNAdb/eccDNABreakpointAnalysis.php
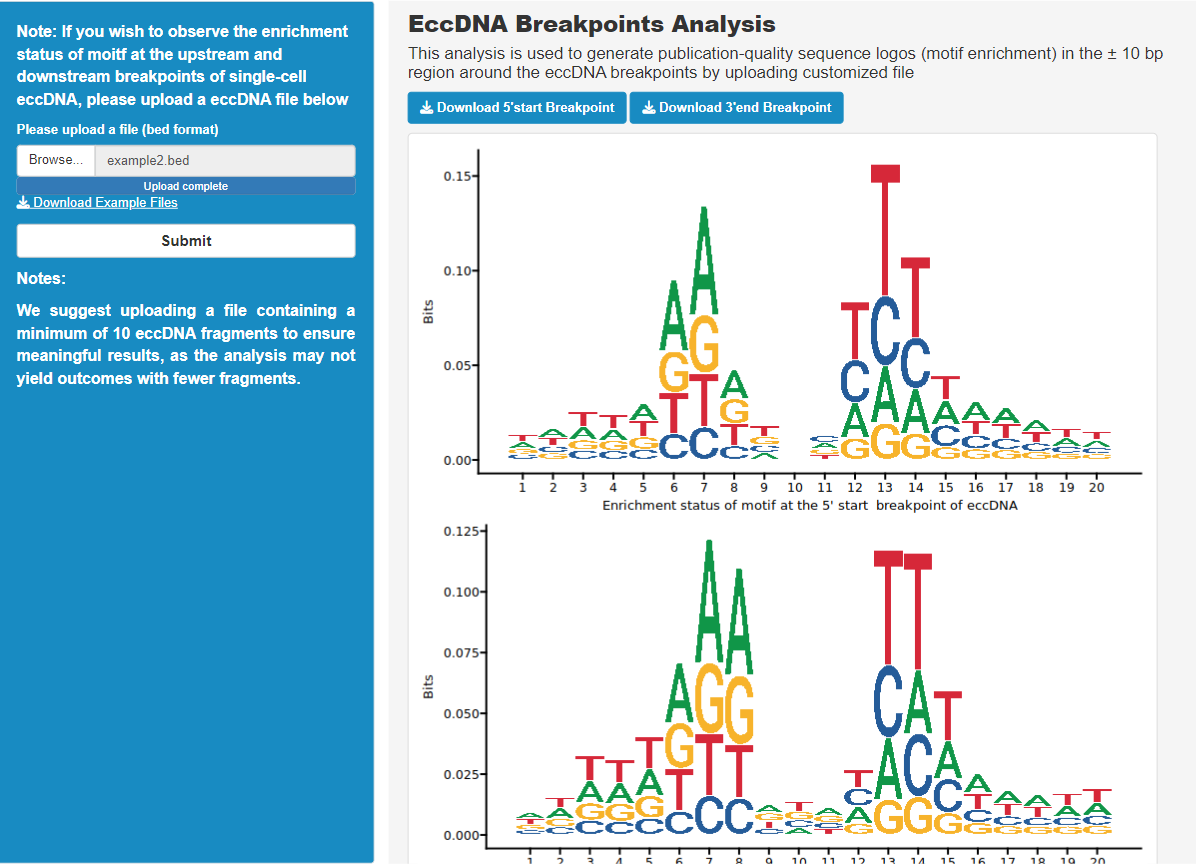
This module is a motif for analyzing ecDNA breakpoints. Users can submit a single-cell ecDNA bed file, and can observe the enrichment status of moitf at the upstream and downstream breakpoints of the single-cell ecDNA, and assess the conservation of sequences in the vicinity of the ecDNA breakpoints. It is important to note here that it is recommended to upload a file containing at least 10 eccDNA fragments,. The default genome version used in this analysis is hg19, and the resulting image can be downloaded by clicking the download button.
The results of the analysis of the example data are as follows.
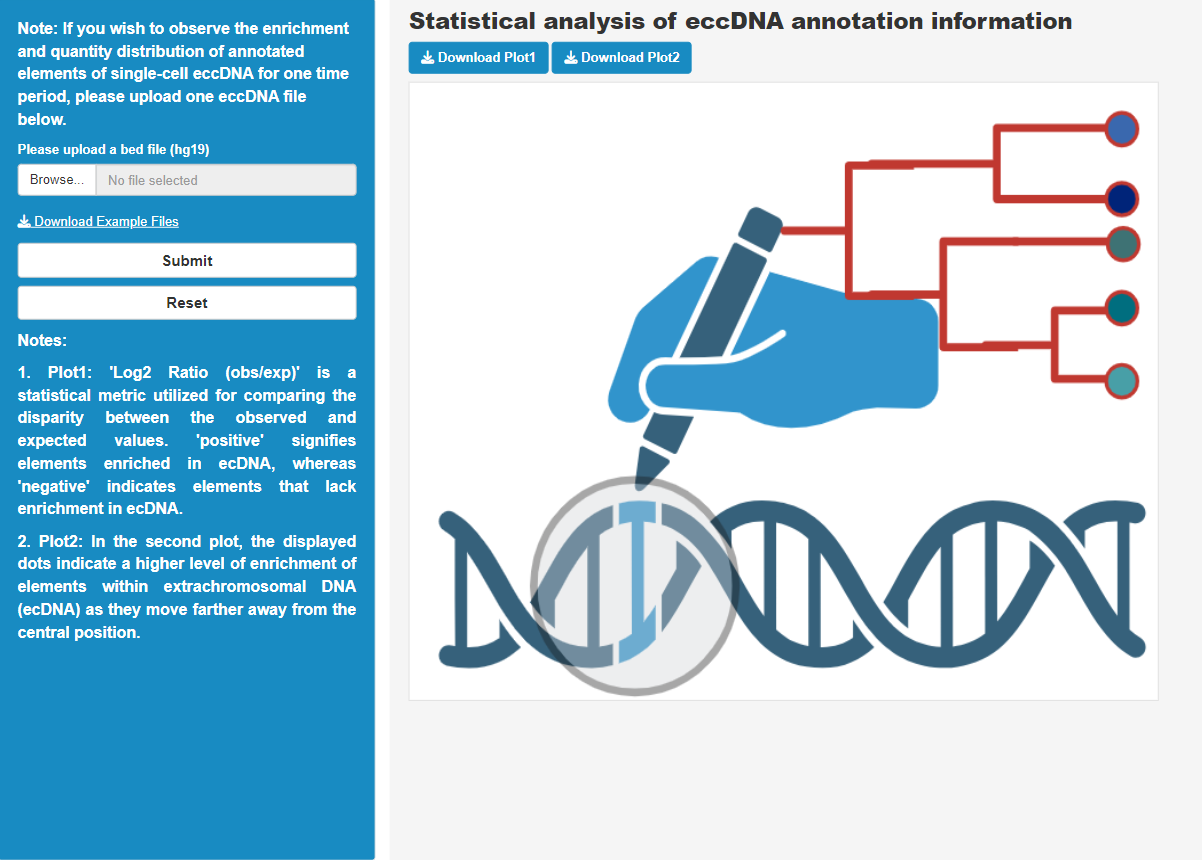
URL:https://lcbb.swjtu.edu.cn/scEccDNAdb/eccDNAAnnotationAnalysis.php
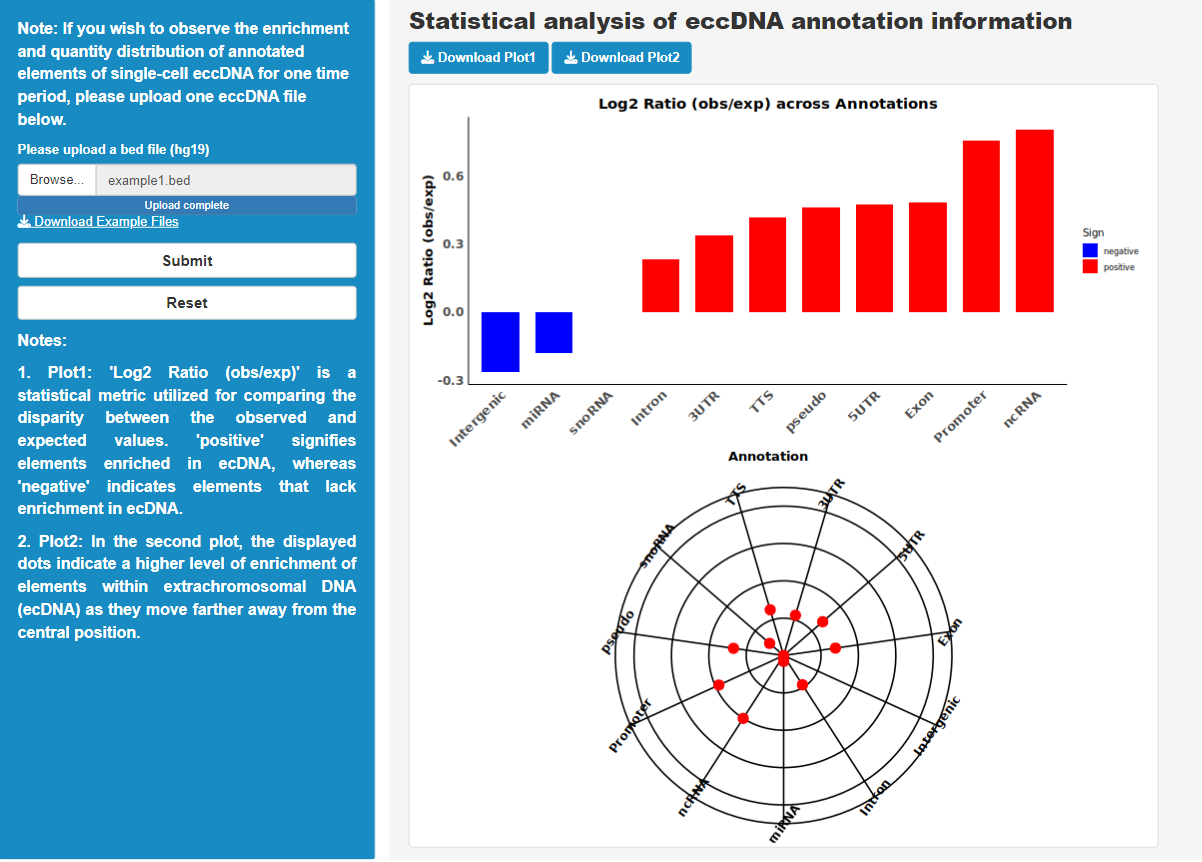
This module is for statistical analysis of ecDNA annotation information. Users can submit a bed file of ecDNAs from a single cell, and can observe the distribution of the enrichment and number of annotated elements on ecDNAs from a single cell over a time period. The analysis results will reveal which elements are highly enriched on eccDNAs and the distribution of peak counts of elements annotated on eccDNAs. In the first figure, "positive" indicates elements that are enriched in eccDNAs, while "negative" refers to elements that are not enriched in eccDNAs. The second plot is characterized by an outward localization of the red dots that correlates with increased enrichment within the eccDNA; conversely, closer to the center indicates lower or no enrichment. The default genome version used in this analysis is hg19, and the resulting image can be downloaded by clicking the download button.
The results of the analysis of the example data are as follows.
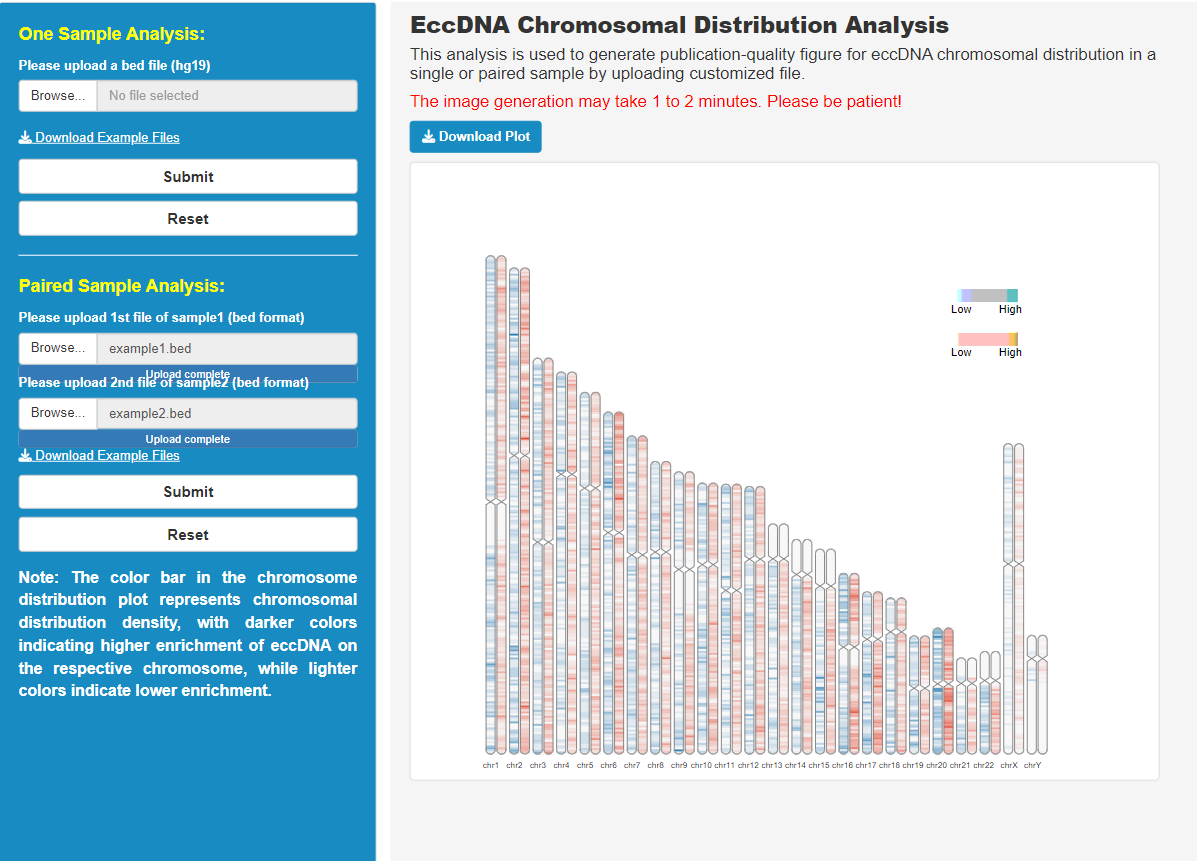
URL:https://lcbb.swjtu.edu.cn/scEccDNAdb/eccDNADistributionAnalysis.php
Users can submit a gene list, choose the species (human or mouse), select at least one pathway database, set p-value/FDR and set gene number thresholds. eRNAbase will identify enriched pathways in up to the select pathway databases. In each pathway, eRNAbase will locate the terminal TFs and extract the terminal TF bound downstream eRNAs. Therefore, users can find the pathway/TFs/eRNAs/target genes regulatory axes.
The results of the analysis of the example data are as follows.
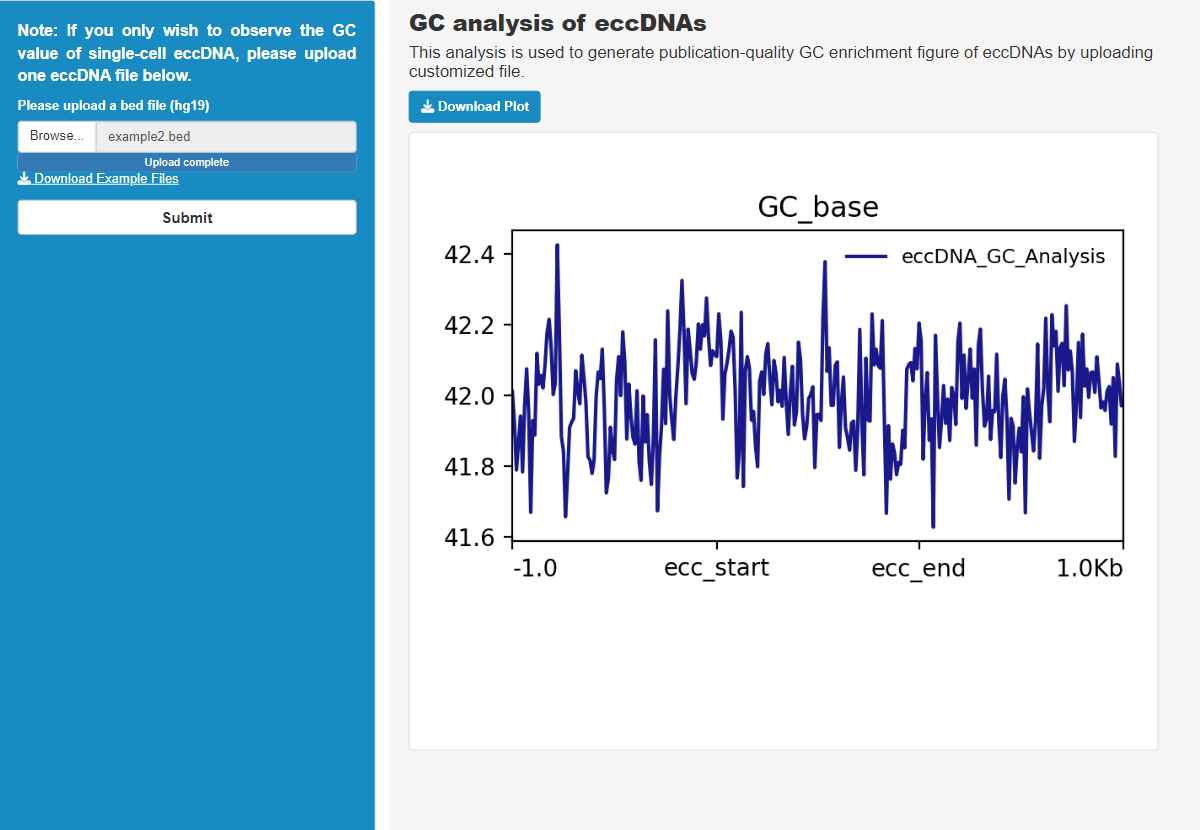
URL:https://lcbb.swjtu.edu.cn/scEccDNAdb/eccDNAGC.php
Users can submit a bed file of eccDNA from a single cell to get GC value, the default genome version used in this analysis is hg19, and the results can be downloaded by clicking the download button.
The results of the analysis of the example data are as follows.
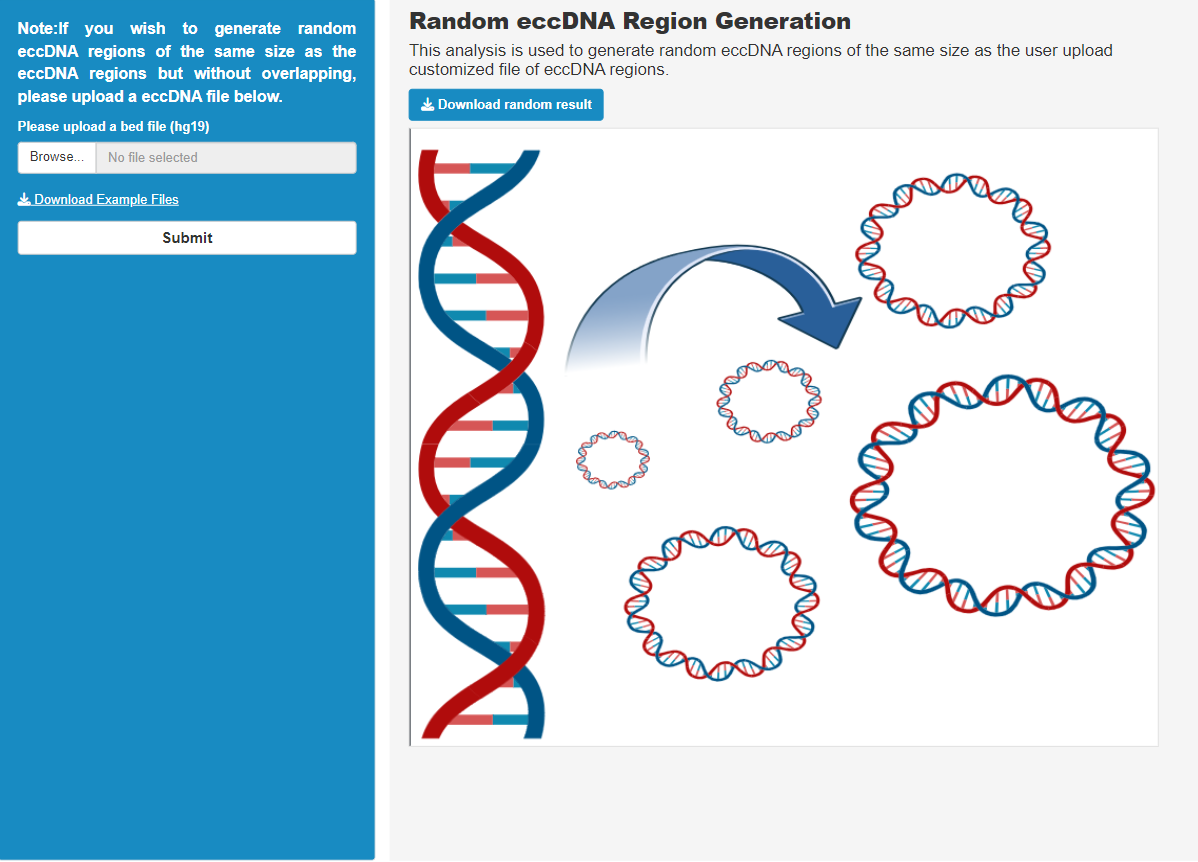
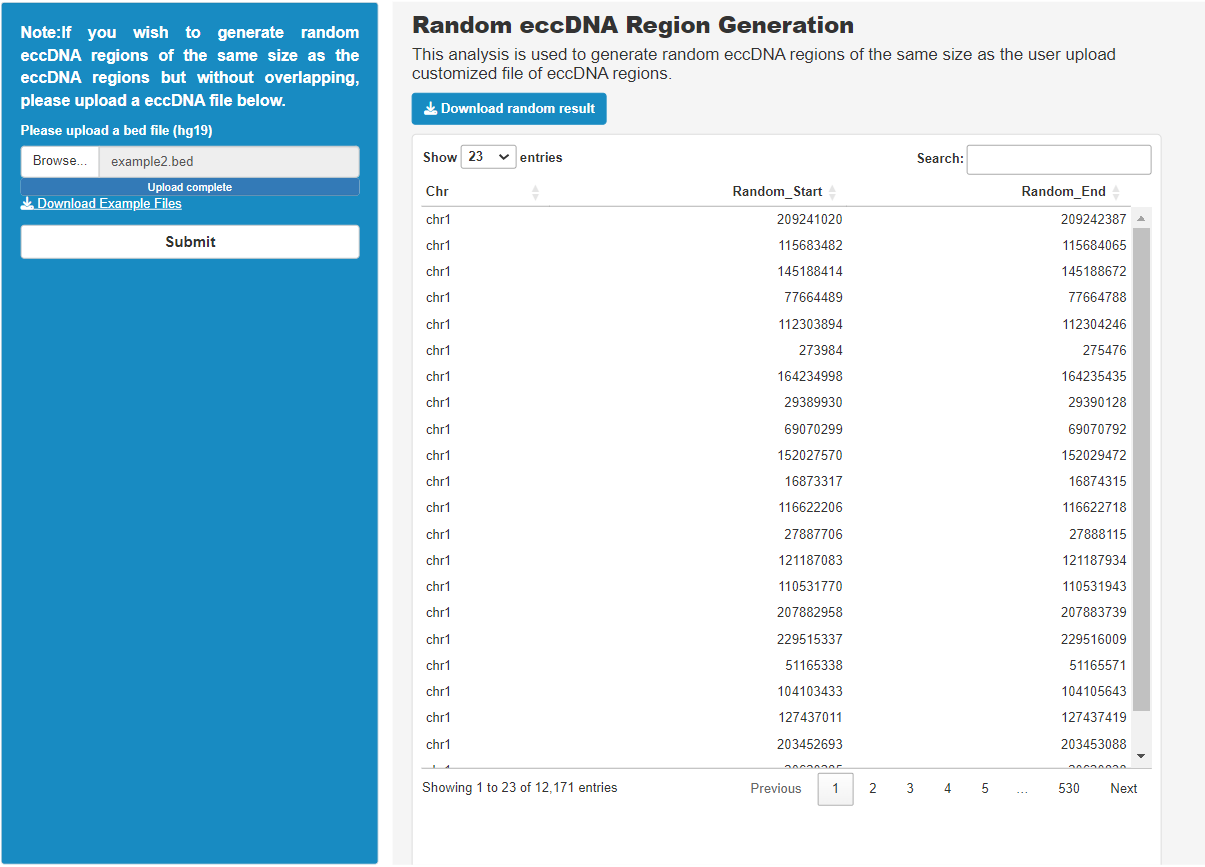
URL:https://lcbb.swjtu.edu.cn/scEccDNAdb/eccDNAGeneration.php
This module is for the generation of random eccDNA regions. Users can submit a bed file to generate a random eccDNA region that is the same size as the eccDNA region but does not overlap. The default genome version used in this analysis is hg19, and the results can be downloaded by clicking the download button.
The results of the analysis of the example data are as follows.
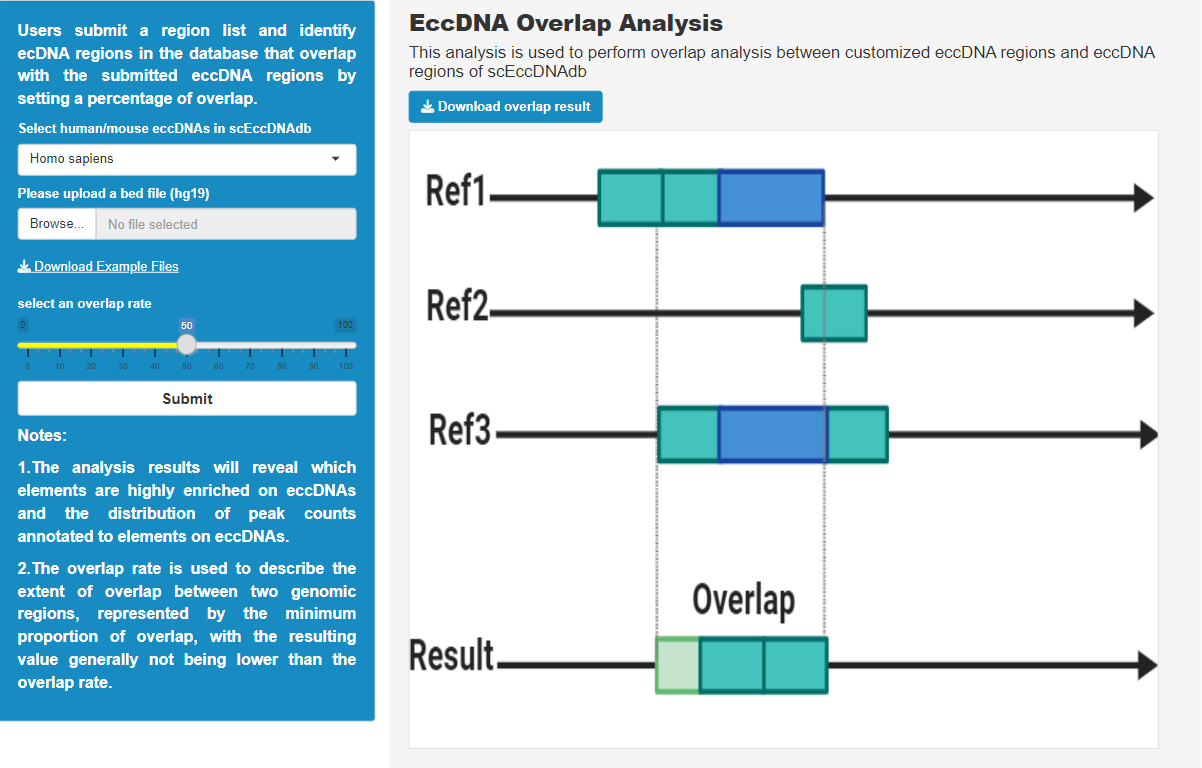
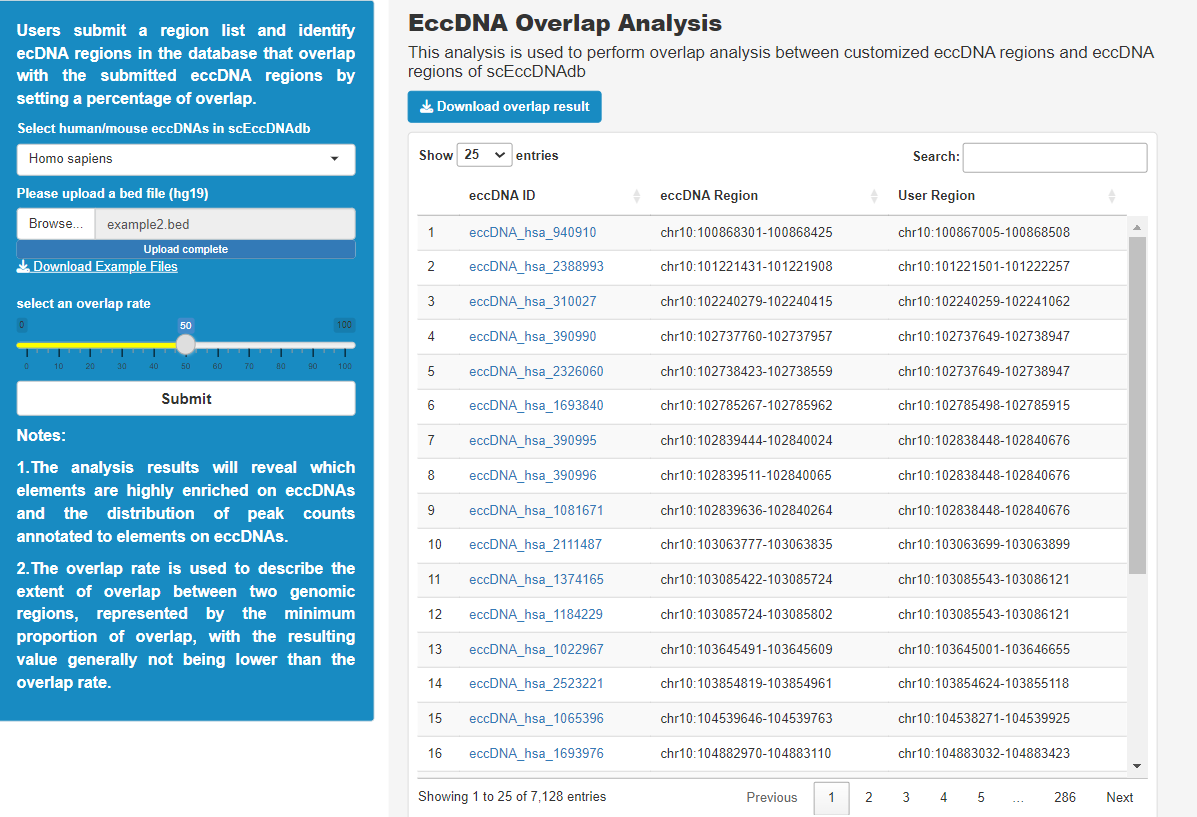
URL:https://lcbb.swjtu.edu.cn/scEccDNAdb/eccDNAOverlap.php
The user can submit a list of regions and determine the eccDNA regions in the database that overlap with the submitted eccDNA regions by setting the percentage of overlap. The results of the analysis will reveal which elements are highly enriched on the eccDNAs and the distribution of peak counts of elements labeled on the eccDNAs. The default genome version used in this analysis is hg19, and the results can be downloaded by clicking the download button.
The results of the analysis of the example data are as follows.
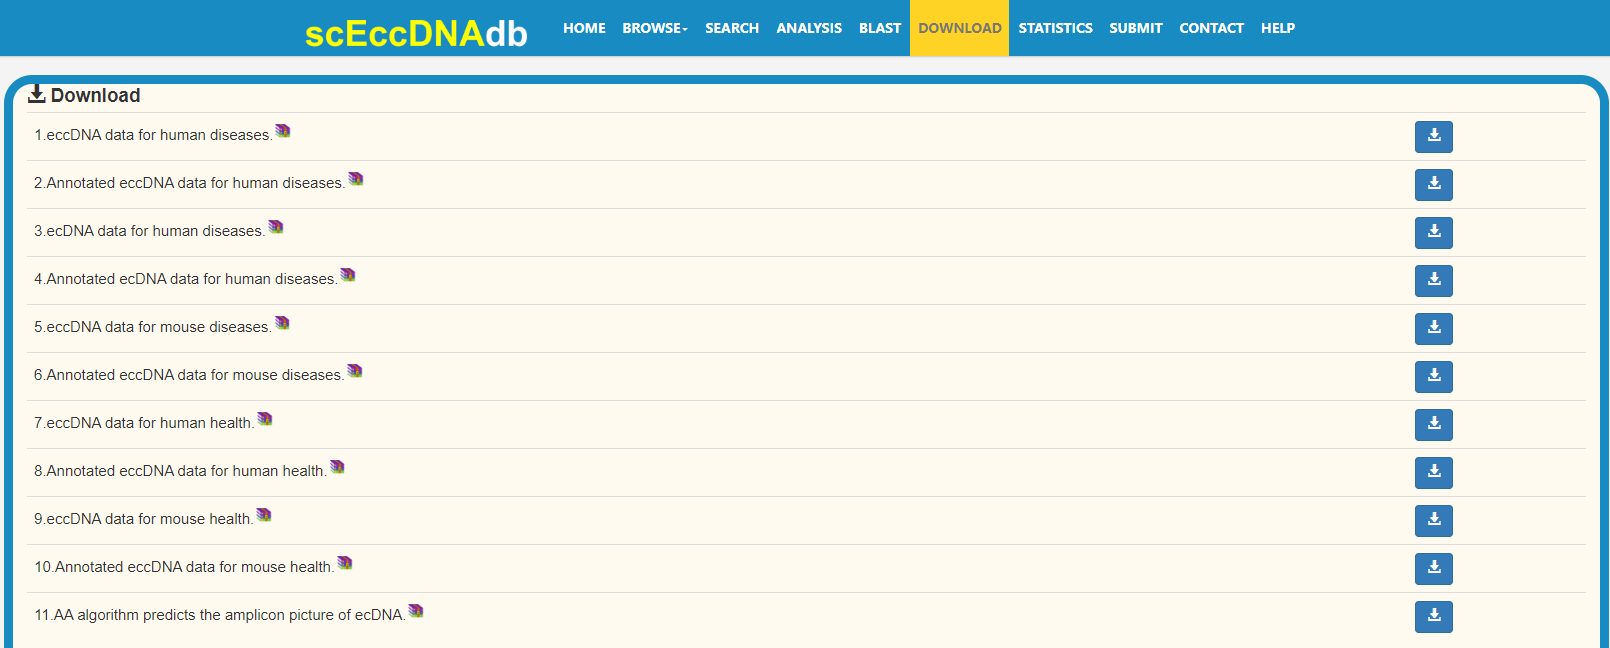
URL:https://lcbb.swjtu.edu.cn/scEccDNAdb/Download.php
The corresponding eccDNA information results for each species as well as annotation information can be downloaded from the "Download" page. Users can quickly download the relevant information. In addition, we have provided images of amplicons obtained for all AA predicted ecDNAs.
The current version of scEccDNAdb was developed using MySQL 5.7.17 (http://www.mysql.com) and runs on a Linux-based Ngnix server (https://nginx.org/). We used PHP 7.0 (http://www.php.net) for server-side scripting. We designed and built the interactive interface using Bootstrap v3.3.7 (https://v3.bootcss.com) and JQuery v2.1.1 (http://jquery. com). We used ECharts (http://echarts.baidu.com) as a graphical visualization framework. For a better browsing experience, we recommend using Firefox browser or Google Chrome browser.
